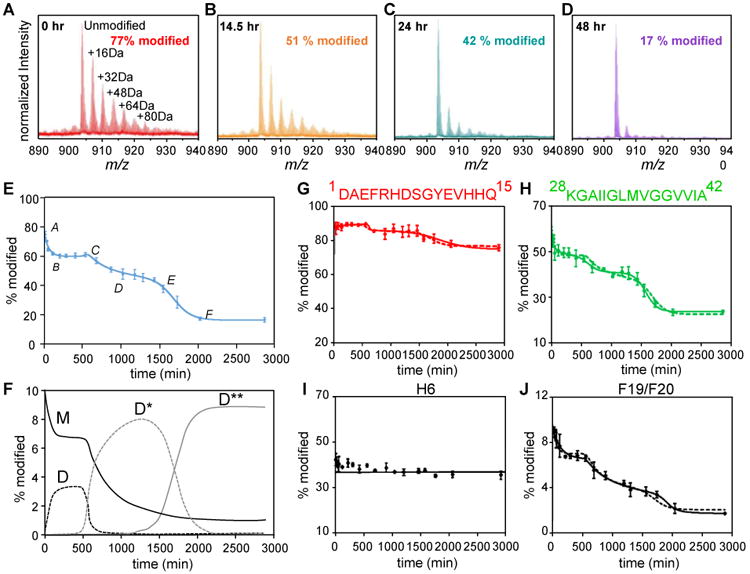
Figure 3. FPOP and kinetic modeling characterize the time-dependent aggregation of Aβ1-42 at protein, peptide and amino-acid residue levels.

(A-D) Mass spectra showing extents of FPOP modification for intact Aβ1-42 (5+ charge) as a function of the incubation time. The determined modification percentage is shown in each panel. (E) Characterization of Aβ1-42 aggregation on the global (full-polypeptide) level by a kinetic simulation. Points represent experimental data, and the solid curve is a model fit based on two auto-catalytic reactions. (F) Concentrations (in monomeric equivalents) change of representative Aβ1-42 species (M-monomer, D-paranuclei, D*-protofibrils and D**-fibrils) from kinetic simulation. (G-H) Aggregation curves of N-terminal region 1-15 and C-terminal region 28-42. (I-J) Aggregation curves of representative Aβ1-42 residues H6 and F19/F20. In G-J, the solid and dashed curves are model fits independent of or constrained by the global rates, respectively. Adapted with permission from ref. 5. Copyright 2016 American Chemical Society.
