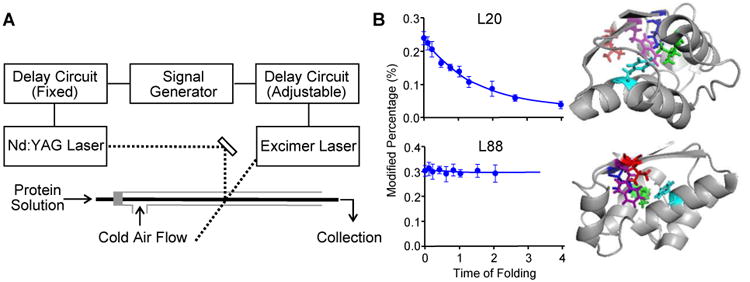
Figure 4. Folding of barstar characterized by a T-jump FPOP.

(A) Schematic representation of the two-laser FPOP platform. As in Figure 2A, the transparent window is located where the two laser beams (dash lines) are incorporated. (B) Left: FPOP modification percentage of two representative residues as a function of the protein (barstar) folding time. Solid lines in the plots are obtained from kinetic fitting. Right: Five critical residues identified by FPOP mapped on native barstar structure. Two views are provided to show the side chains of the amino acid L88 (red), F74 (cyan), I5 (blue), L20 (green), and W53 (purple). Adapted with permission from ref. 7. Copyright 2012 American Chemical Society.
