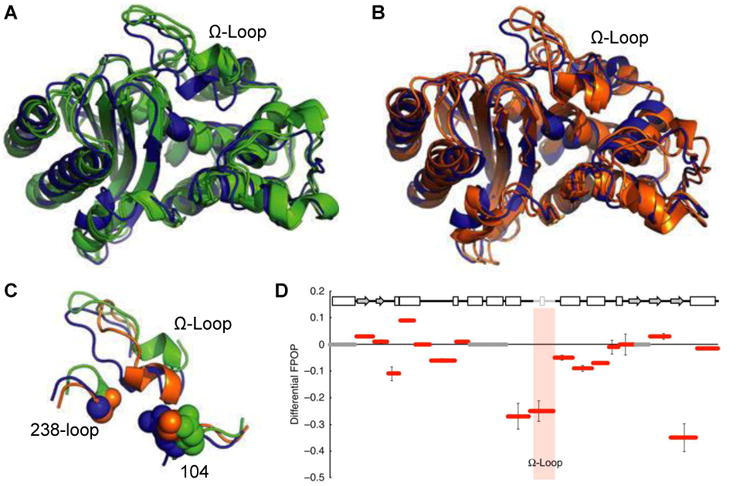
Figure 6. Modeling and FPOP reveal restricted motion in the Ω-loop in cefotaximase variant.

A crystal structure of TEM-1 (blue) is overlaid with the two most populated structures taken from modeling of (A) the non-cefotaximase states (green, favored by wild type) and (B) cefotaximase states (orange, favored by the E104K/G238S). (C) Large structural rearrangements in the Ω-loop distinguish low-energy non-cefotaximase states from cefotaximase states. (D) FPOP data reveal experimentally the restricted motion in cefotaximase variant predicted from modeling. Hydroxyl labelling of TEM variants are shown as the difference in percent labelled between cefotaximase variant and wild type. The Ω-loop (164–179) is shaded grey in the sequence and pink in the graph. Adapted with permission from ref. 11. Copyright 2016 Nature Publishing Group.
