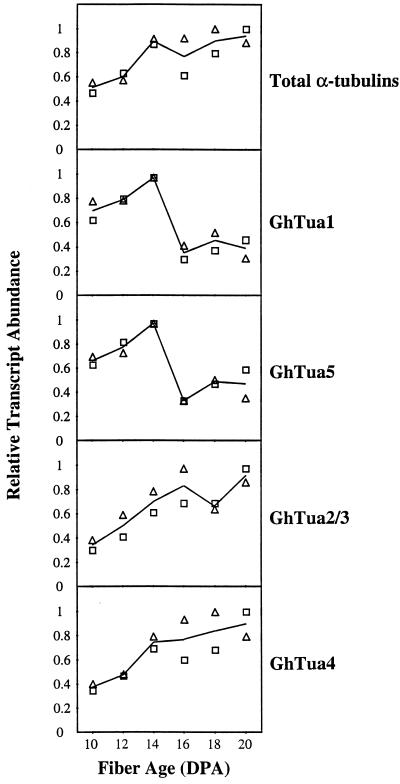
Figure 5.
Quantification of northern analyses of α-tubulin transcript levels in developing cotton fibers. The signals for each α-tubulin probe were quantified by phosphor-imaging the blots. These values were normalized against the 26S rRNA signal and are expressed relative to the highest value in the series. Duplicate northern analyses (not shown) were performed using independently extracted RNA samples. □, Results shown in Figure 4A; ▵, results of duplicate northern analyses.

