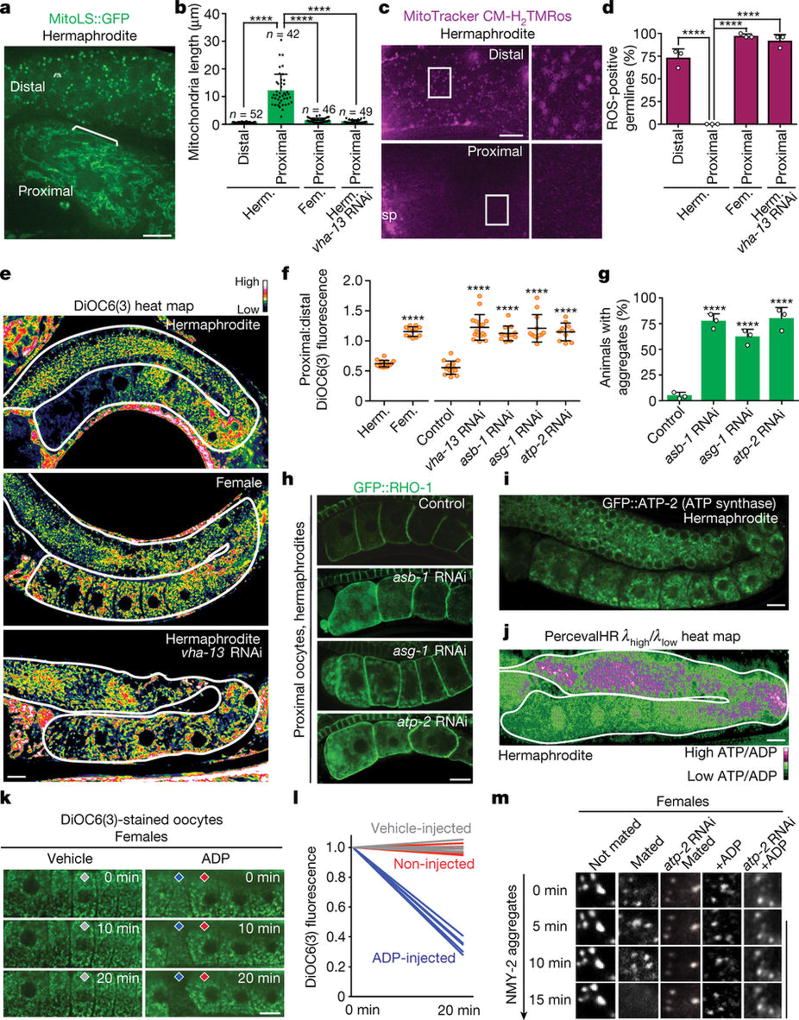
Figure 4. Mitochondria aid proteostasis enhancement.
a, Mitochondria labelled with MitoLS::GFP. b, Lengths of mitochondria (mean ± s.d.) in distal and proximal germlines. c, Germlines stained with MitoTracker CM-H2TMRos. Sp, sperm. d, ROS-positive germlines. Mean ± s.d. from three biological replicates, each of n = 50 animals. ****P < 0.0001. e, DiOC6(3) heat maps. f, Proximal:distal DiOC6(3) fluorescence ratios (mean ± s.d.). ****P < 0.0001. g, h, GFP::RHO-1-aggregation in hermaphrodites after knockdown of ATP synthase subunits. Mean ± s.d. from three biological replicates, each of n = 50 animals. ****P < 0.0001. i, GFP::ATP-2 ATP synthase localization. j, PercevalHR λhigh/λlow heat map. k, l, DiOC6(3) staining of oocytes, showing mitochondrial membrane-potential fluorescence following ADP injection. n = 5 oocytes per condition. m, Aggregate movement. Bars, 10 µm.

