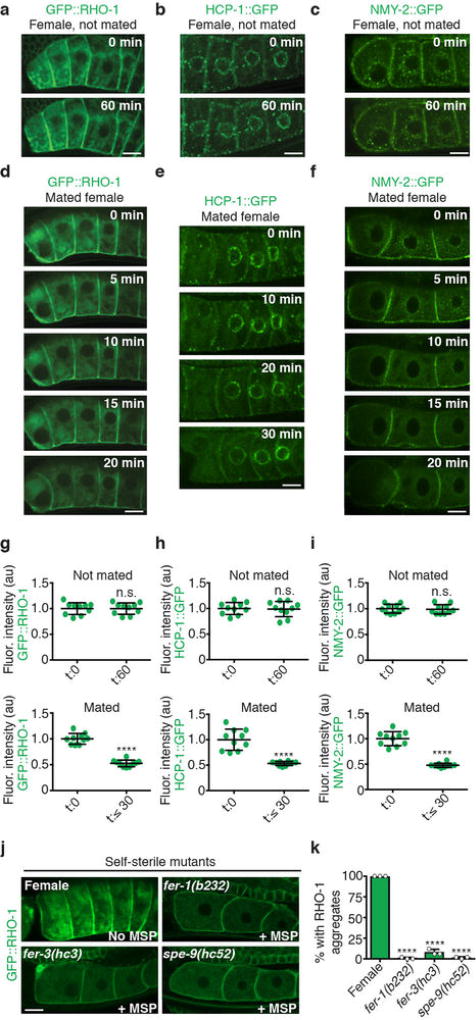
Extended Data Figure 2. Signals from sperm reduce protein aggregation in oocytes.
a–f, Time-lapse images of aggregation-prone proteins in oocytes of females, or females after mating. g–i, Localized fluorescence intensities in oocytes of mated females and non-mated controls. Mean ± s.d. for n = 10 aggregate sites. NS, not significant. ****P < 0.0001. j, k, GFP::RHO-1-aggregation in females and sperm-defective hermaphrodite mutants that still produce MSPs. Mean ± s.d. from three biological replicates, each of n = 50 animals. ****P < 0.0001. Bars, 10 µm.

