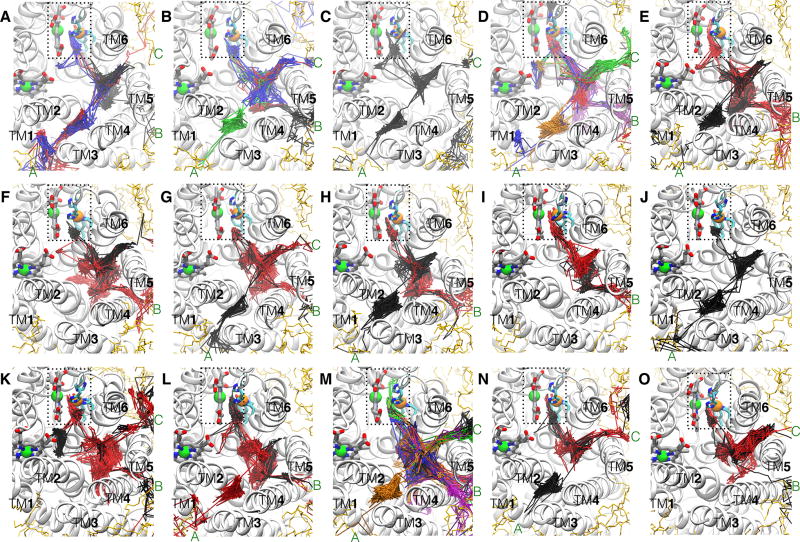
Figure 4.
O2 access routes. The trajectories of the delivered O2 molecules into the reduction site during each of the 15 simulations are illustrated by line traces with different colors. O2 molecules enter the X-ray inferred pathway via three membrane-accessible branches, denoted as “A”, “B” and “C”. Branch A originates at TM1, TM2 and TM3. Branch B originates at TM4 and TM5 which is adjacent to SIII. Branch C, which was previously unknown, originates at TM5 and TM6. In some of the simulations, O2 were found entering via all 3 branches, whereas in others, they entered via only 1 or 2 of the branches were visited by O2. In relation to Table 1, panels A–D denote Sims. 1A–D, panels E–H denote Sims. 2A–D, panels I–K denote Sims. 3A and 3D–E, and panels L–O denote Sims. 4A–B and 4D–E.

