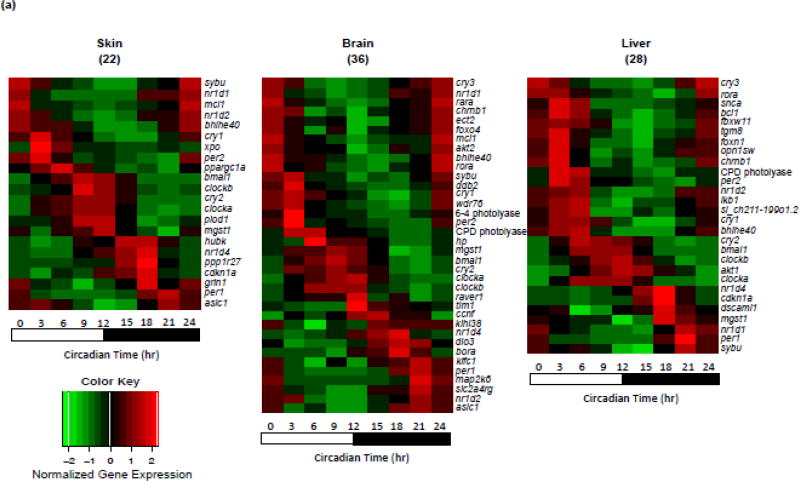
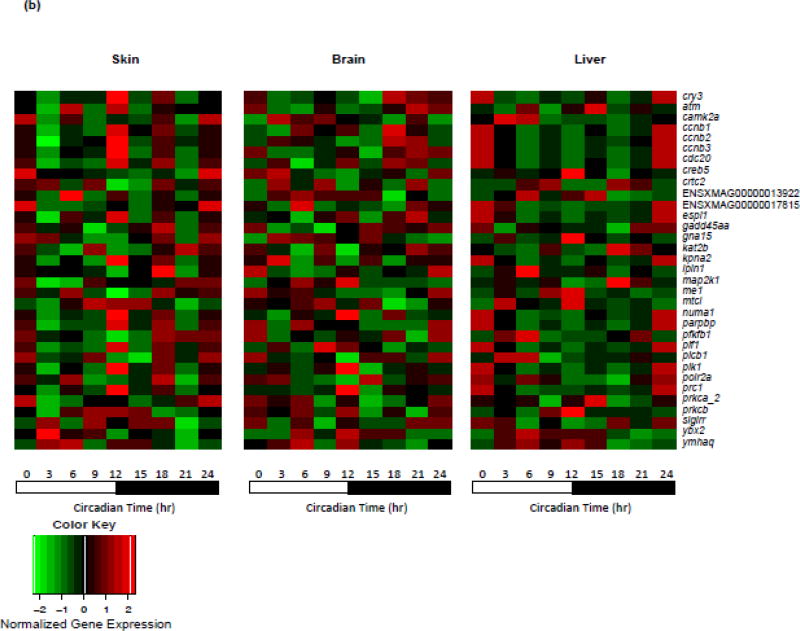
Figure 2. Expression patterns of basal oscillating genes in skin, brain and liver. Heatmap.
(A) Basal oscillating gene expression patterns identified in skin, brain and liver are represented. Twenty-two genes (13 light responsive genes) were identified in skin, 36 genes (20 light responsive genes) were identified in brain and 28 genes (16 light responsive genes) were identified in liver. Gene expression is normalized to the mean expression level over the entire diurnal cycle and scaled for visualization. Genes are ordered on the Ct time when they exhibited peak expression. (B) Thirty-three genes that are light-responsive and do not exhibit diurnal oscillation of expression in any of the organs tested are represented. Expression of these light-responsive, non-circadian influenced genes (ordered alphabetically) was normalized to the mean expression level over the entire diurnal cycle.


