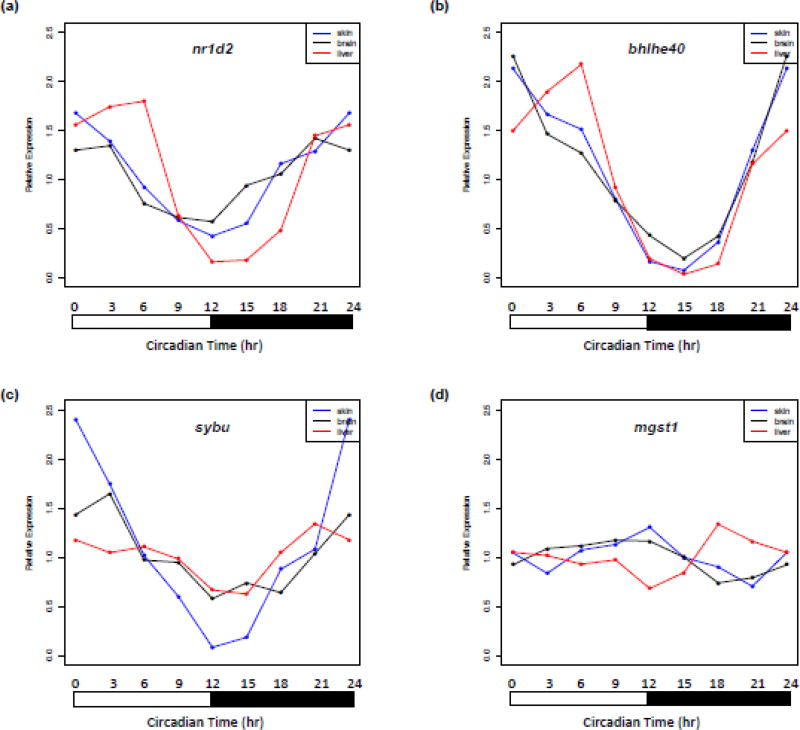
Figure 3. Shift in peak expression times of select basal oscillating genes in different organs.
(A) nr1d2 shows peak expression at Ct 0 and Ct 21 hr in skin and brain, but peak expression at Ct 6 hr in liver. (B) bhlhe40 shows peak gene expression at Ct 0 hr in both skin and brain, while exhibiting peak expression at Ct 6 hr in liver. (C) Circadian times for peak gene expression of sybu are Ct 0, Ct 3 and Ct 21 hr, respectively in skin, brain and liver. (D) mgst1 exhibits peak expression at Ct 12 and Ct 9 hr in skin and brain, but peak expression at Ct 18 hr in liver.

