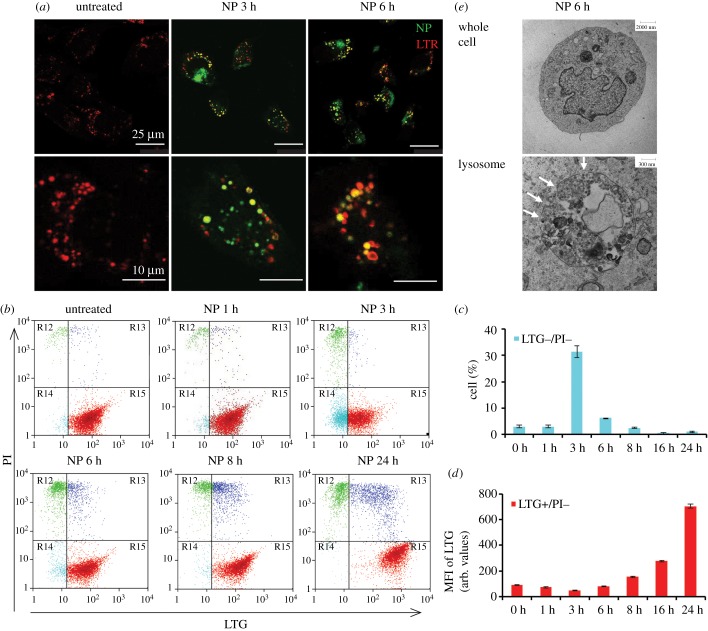
Figure 1.
Confocal imaging and flow cytometric analysis show NH2-PS NPs induce lysosomal damage. (a) Confocal images of LTR staining. MEF cells were treated with NH2-PS NPs (green) for 0, 3 and 6 h and stained with LTR (red). The images indicate accumulation of NPs into lysosomes at 3 h and lysosomal swelling at 6 h. Zoomed images of cells are shown in the bottom panel. The quantification of lysosomal size is shown in electronic supplementary material, figure S1. (b) Flow cytometric analysis of LTG/PI double staining. MEF cells were treated with NH2-PS NPs for indicated time points and stained with LTG and PI. The dot plots of PI versus LTG are illustrated. (c) The percentage (%) of LTG−/PI− cells in (b) at indicated time points. (d) The MFI of LTG of LTG+/PI− cells in (b) at indicated time points. Results are the mean of three experiments, each with two replicates, and the error bars are the standard deviations. (e) TEM images of 1321N1 cells treated with NPs for 6 h. A whole cell is shown in the top panel and a lysosome from this cell is shown in the bottom panel. White arrows indicate permeabilized lysosomal membrane.

