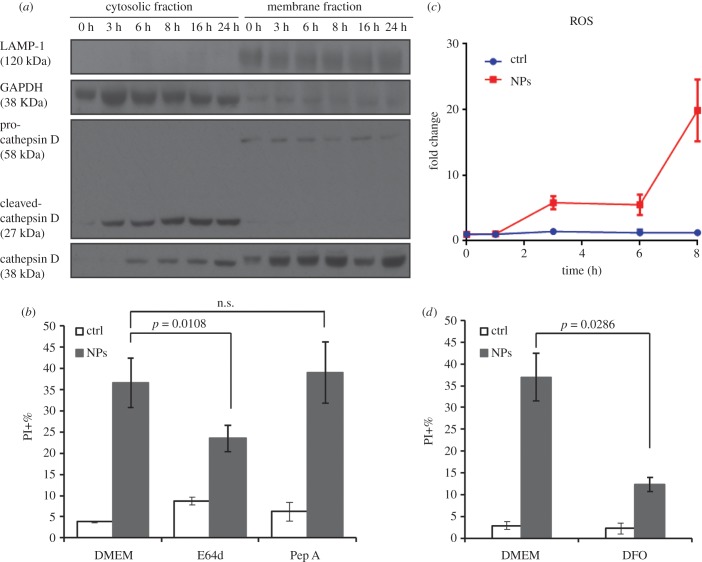
Figure 2.
Cytosolic release of lysosomal proteases upon exposure of NH2-PS NPs and lysosomal cell death. (a) Western blot of cytosolic release of lysosomal proteases. MEF cells were treated with NPs for indicated time points, followed by cell fractionation to obtain cytosolic and membrane fractions. Both fractions were subjected to western blot to detect indicated proteins. LAMP1 is a lysosomal marker and GAPDH is a cytosolic marker, the results of which show no cross-contamination of cytosolic and lysosomal fractions. Cathepsin D and B can be detected in the cytosolic fraction after 3 h and 6 h exposure to NPs, respectively. (b) Cell death induced by NH2-PS NPs with or without lysosomal protease inhibitors. The percentages of PI positive cells were measured by flow cytometry. (c) ROS generation upon exposure to NH2-PS NPs. MEF cells were treated with NPs as described above at indicated time points, followed by staining of 2.5 µM CM-H2DCFDA and flow cytometric measurement. The MFI of cellular CM-H2DCFDA fluorescence is normalized by that of untreated cells at time 0. The fold changes are plotted here. (d) Cell death caused by NH2-PS NPs in the presence or absence of lysosomal iron chelator DFO. Results are the mean values of three experiments, each with two replicates, and the error bars are the standard deviations. One-way ANOVA was used to analyse the statistical significance.

