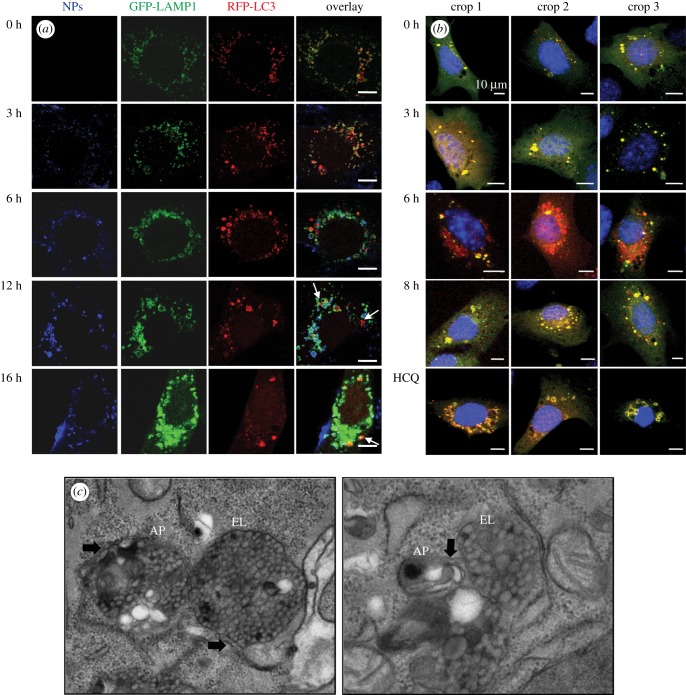
Figure 3.
NH2-PS NPs induce accumulation of autophagosomes. (a) Confocal images of autophagosomes and lysosomes after NP treatment. MEF cells were co-transfected with LC3-RFP (red) and LAMP-1 (green), and exposed to NH2-PS (blue) for indicated time points. White arrows indicate the autophagosomes that do not colocalize with lysosomes. The scale bar is 10 µm. (b) Confocal images of MEF cells transfected with tf-LC3 plasmid followed by exposure to NH2-PS NPs for indicated times or HCQ. (c) TEM images of autophagic vesicles. AP, autophagosome; EL, endolysosome. Black arrows indicate the double membrane structures of AP. The magnification levels of the images are 50 000× and 80 000×, respectively.

