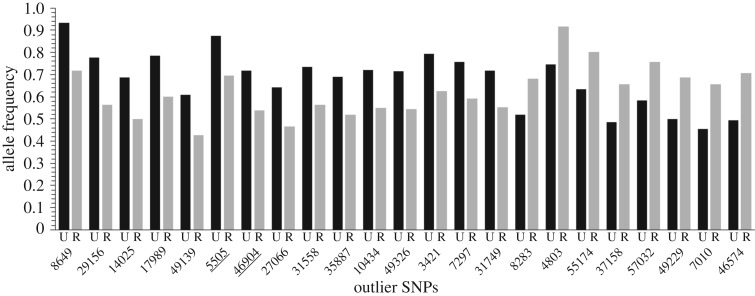
Figure 3.
Allele frequencies of the commonest allele for candidate loci (n = 24) identified as outliers by at least two approaches (LOSITAN, BayeScan and BayeScEnv) and to which we could assign GO terms, ordered left to right from largest positive difference (urban > rural) to largest negative difference (urban < rural). Highlighted are the two loci found in genes coding for calmodulin (5505) and serine/threonine protein kinase (46904). The frequency of the outlier SNP within each land use type, urban (U, black) or rural (R, grey), is plotted on the vertical axis. Each candidate locus is labelled with the contig name on the horizontal axis; see highlighted rows in electronic supplementary material, table S7.

