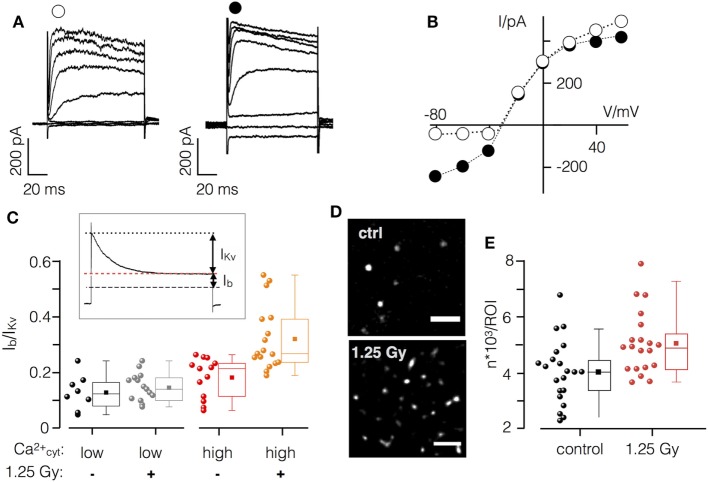
Figure 7.
X-ray irradiation activates Ca2+ sensitive K+ channel in Jurkat cells. (A) Current responses of un-irradiated (left) and irradiate (right) Jurkat cell in whole cell configuration with high (1 µM) cytosolic Ca2+ to test voltages between −80 and +60 mV. (B) Peak current/voltage relation of cells in (A). Symbols in (A) correspond to symbols in I/V plot. (C) Inset: during long clamp steps, the time-dependent Kv1.3 current inactivates (IKv) leaving the voltage-independent background current Ib. Ratio of Ib/IKv from non-irradiated (−) and irradiated (+) Jurkat cells (1.25 Gy) with low (<100 nM) or high (1 µM) [Ca2+]cyt. (D) Single molecule resolution images of KCa2.2 channels in plasma membrane of irradiated (1.25 Gy) and non-irradiated Jurkat cells (scale bar = 1 µm). (E) Mean number of KCa2.2 molecules in control cells (black symbols) and 48 h after irradiation (red symbols). Each circle represents an individual region of interest (ROI) of a single Jurkat cell. Box plot symbols have the same meaning as in Figure 2.

