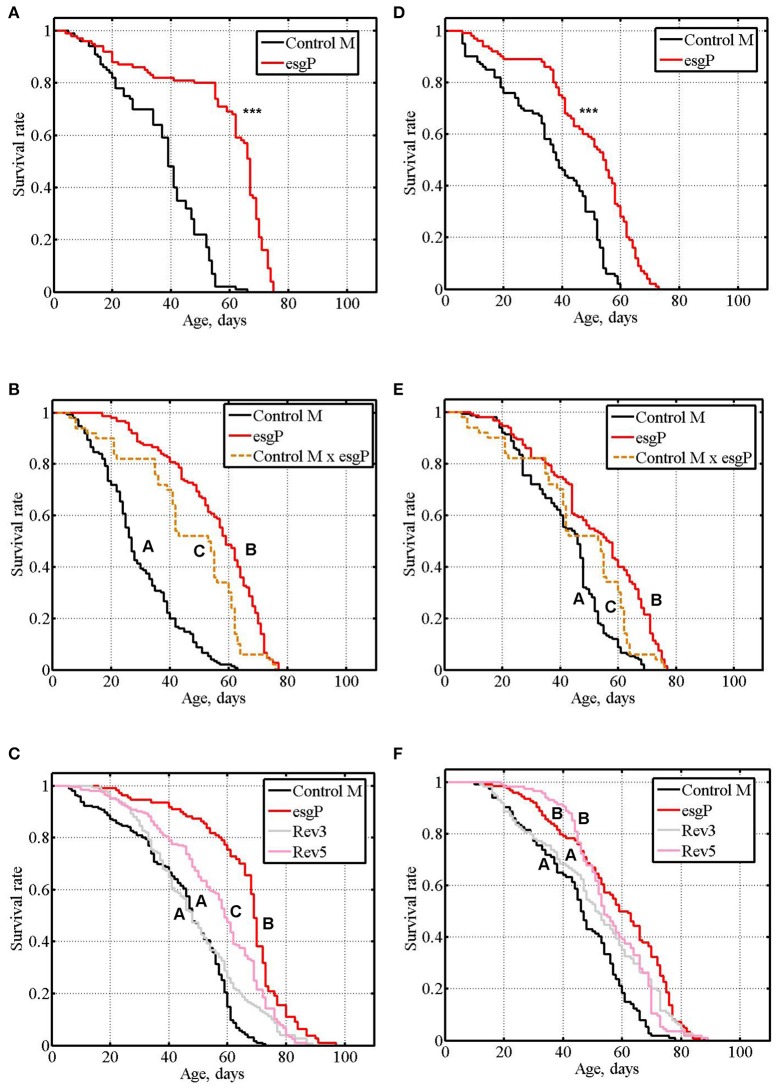
Figure 2.
Survival of unmated mutant and revertant flies. (A–C): experiments #3, #4, #5 with males. (D–F): experiments #3, #4, #5 with females. Asterisks denote significant differences with the Control M line, as determined by the Mann-Whitney test (***P < 0.001). Letters A, B, and C indicate the results of Tukey tests for significant differences between different genotypes. Genotypes with the same letter are not significantly different from each other.

