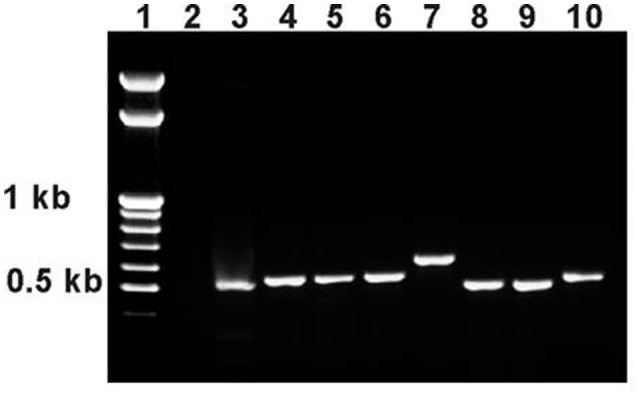
Figure 6.

PCR analysis of esg structure in revertant lines. PCR primers esg1 and esg2 were used with an expected product size of 508 bp. 1: marker (GeneRuler™ 100 bp Mass DNA Ladder, Fermentas); 2: esgP (negative control, an expected PCR product of approximately 9 kb is not produced under the PCR conditions used); 3: Control M; 4: Rev1.1; 5: Rev1.2; 6: Rev2.1; 7: Rev2.2; 8: Rev3; 9: Rev4; 10: Rev5.
