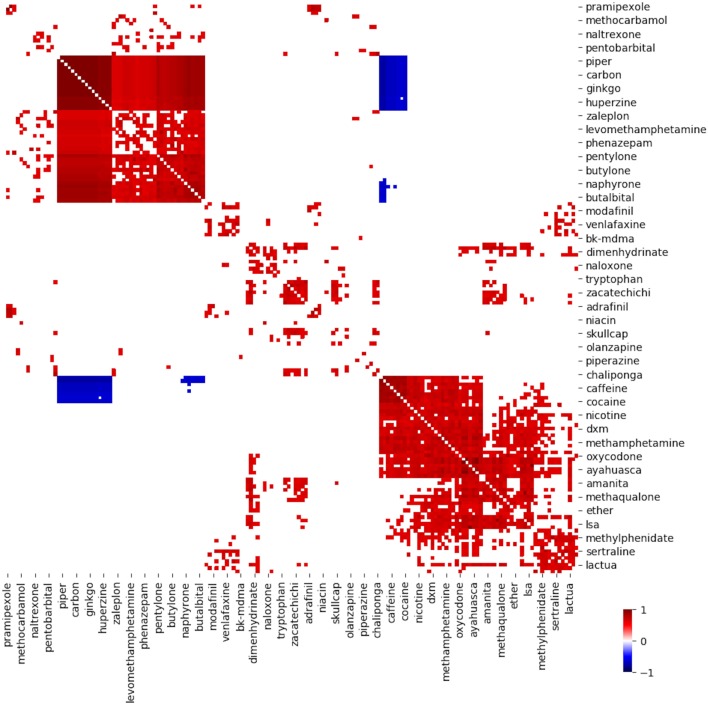
Figure 2.
Heat map of correlation coefficient of substance–substance co-mention pairs whose correlation was statistically significant. Each tiny box represents one pair of substances. Drug names on x- and y-axis specify the pair associated with each box. Color of tiny box indicates correlation, according to scale up in lower right.

