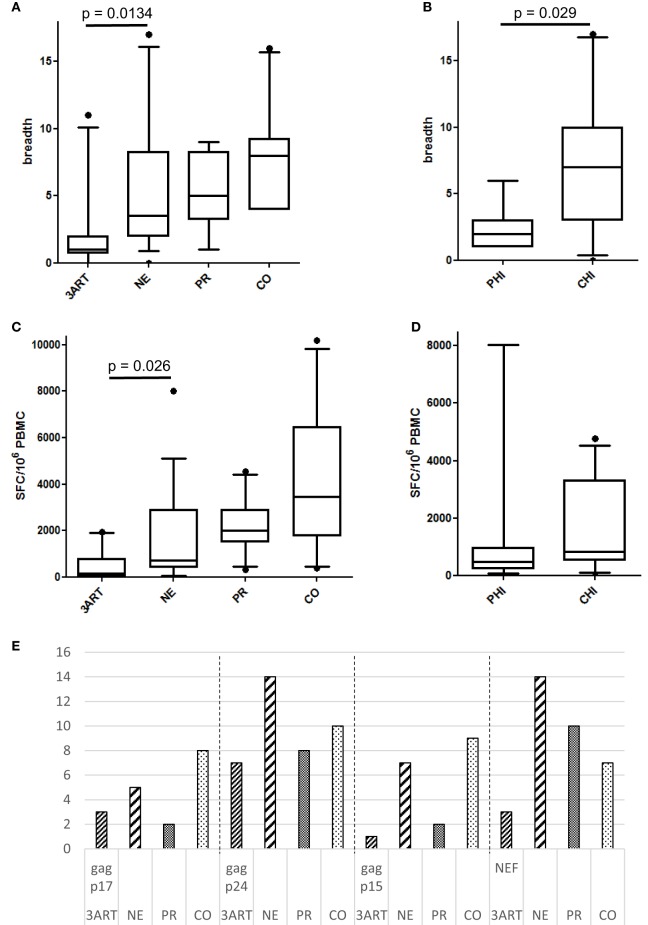
Figure 5.
(A) Breadth of immune responses in the New Era (NE) and control groups. The NE patients had significantly more CD8 T cell responses in Gag and Nef than the 3ART patients (p = 0.0134). (B) The chronic HIV infection (CHI) subgroup showed a significantly higher breadth of immune responses than the primary HIV infection (PHI) subgroup (p = 0.029). (C) The magnitude of the NE group was significantly higher than in the 3ART patients (p = 0.026). (D) There was no difference between the PHI and CHI subgroups, with regard to the magnitude of the CD8 T cell response (p = 0.28). (E) Gag p17 and Gag p15 were more often recognized by the NE (especially CHI) and CO groups than by the progressor (PR) and 3ART groups. Spot-forming cells (SFC)/106 peripheral blood mononuclear cells (PBMCs). For the magnitude of the CD8 T cell response, all the individual CD8 T cell responses within Gag and Nef were added for each patient [3ART: n = 10; NE: n = 18 (PHI: n = 7; CHI: n = 11); PR: n = 10; CO: n = 10].

