Figure 5.
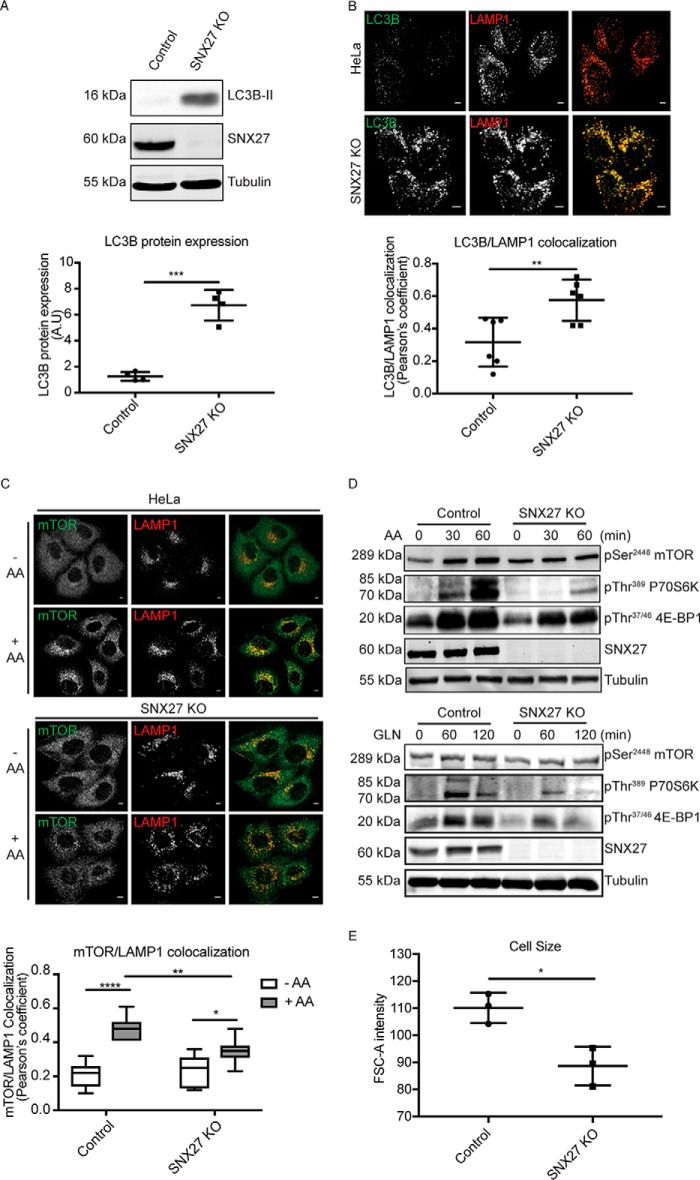
Knockout of SNX27 increases autophagy induction and decreases mTOR activation in HeLa cells. A, equal amounts of protein from HeLa and SNX27 KO HeLa cells were subjected to Western blotting and labeled with antibodies against LC3B, SNX27, and tubulin. Representative images are from at least three independent experiments, and the calculated molecular weight for each protein is indicated. The -fold difference for the LC3B level between HeLa and SNX27 KO HeLa cells is presented (means ± S.D.). A.U., arbitrary units. Two-tailed student's t test indicates the difference between HeLa and SNX27 KO HeLa cells. ***, p < 0.001, HeLa versus SNX27 KO HeLa cells. B, HeLa and SNX27 KO HeLa cells cultured in complete DMEM were fixed and co-labeled with LC3B and LAMP1 antibodies. Analysis of co-localization between LC3B and LAMP1 of 20 cells each is presented by Pearson's correlation coefficient. The value shows the difference between HeLa cells and SNX27 KO HeLa cells (means ± S.D.). Two-tailed student's t test indicates the difference between HeLa and SNX27 KO HeLa cells. **, p < 0.01, HeLa versus SNX27 KO HeLa cells. Scale bars = 5 μm. C, amino acid (AA)–starved HeLa and SNX27 KO HeLa cells were left untreated or treated with 2× AA for 30 min in the presence of 2 mm l-glutamine. Cells were fixed and co-labeled with mTOR and LAMP1 antibodies. Analysis of co-localization between mTOR and LAMP1 of 20 cells each condition is presented by Pearson's correlation coefficient. The value shows the differences between HeLa cells and SNX27 KO HeLa cells (means ± S.D.). Two-tailed Student's t test indicates the difference between HeLa and SNX27 KO HeLa cells. ****, p < 0.0001, HeLa cells (no AA versus AA); *, p < 0.05 SNX27 KO cells (no AA versus AA); **, p < 0.01, HeLa versus SNX27 KO HeLa cells (AA-treated). Scale bars = 5 μm. D, AA-starved parental and SNX27 KO HeLa cells were treated with 2× AA for 30 and 60 min in the presence of 2 mm l-glutamine (GLN) or treated with l-glutamine alone for 60 and 120 min. After cell harvest, equal amounts of protein were used for Western blotting and labeled with antibodies against pSer2448 mTOR, pThr389 P70S6K, pThr37/46 4E-BP1, SNX27, and tubulin antibodies. Representative blots from three independent experiments are shown, and the calculated molecular weight for each protein is indicated. E, HeLa and SNX27 KO HeLa examined by flow cytometry analysis as indicated in Fig. 4B. The relative cell sizes are determined by using the forward scatter (FSC) parameter. The graph represents the relative cell sizes (means ± S.D.). Two-tailed Student's t test indicates the difference between HeLa and SNX27 KO HeLa cells. *, p < 0.05, HeLa parental versus SNX27 KO cells.

