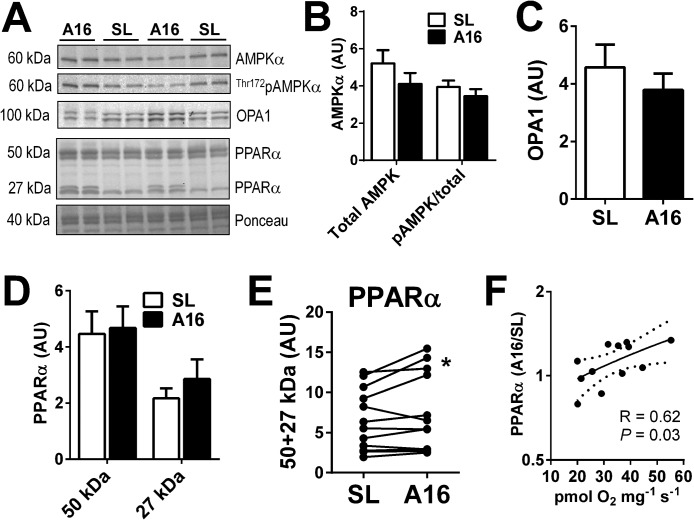
Figure 6.
Putative regulators of muscle metabolic adaptation to high-altitude hypoxia. A–D, representative blots (A) and graphical summaries of muscle protein expression (20 μg) of total and phosphorylated AMP kinase-α (AMPKα; B), GTPase optic atrophy 1 (OPA1; C), and PPARα (D). E, individual subject data of paired SL and A16 (same gel) PPARα protein blots (50 + 27 kDa). F, paired A16/SL blot density ratios of total PPARα (50 + 27 kDa) positively correlate with palmitoylcarnitine-supported OXPHOS capacity at A16 (data from Fig. 5E). *, p < 0.05 by paired t test.

