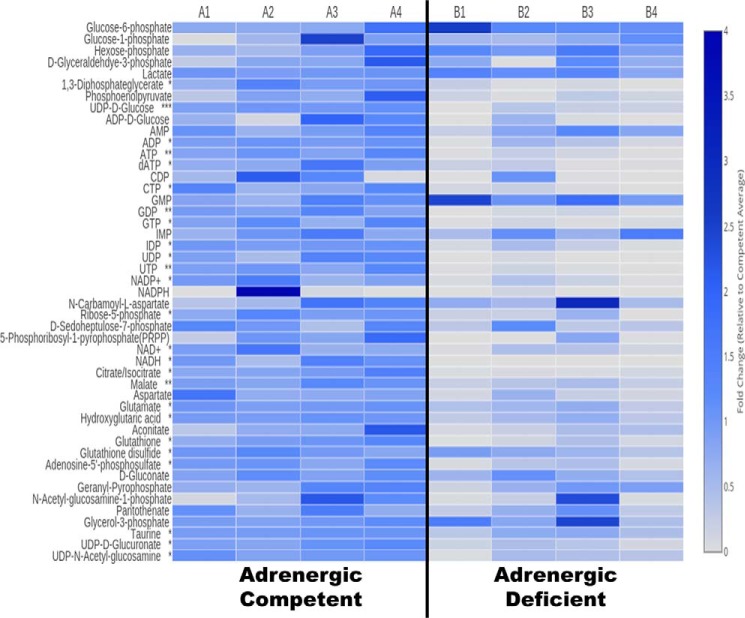
Figure 2.
LC-MS metabolomics analysis of isolated adrenergic hormone-deficient embryonic hearts. Columns A1–A4 represent the adrenergic hormone-competent controls with three embryonic hearts analyzed per group. Columns B1–B4 represent the adrenergic hormone-deficient group with three embryonic hearts analyzed per group. Data are presented as fold-change compared with competent control littermates. *, p < 0.05; **, p < 0.01; ***, p < 0.001.

