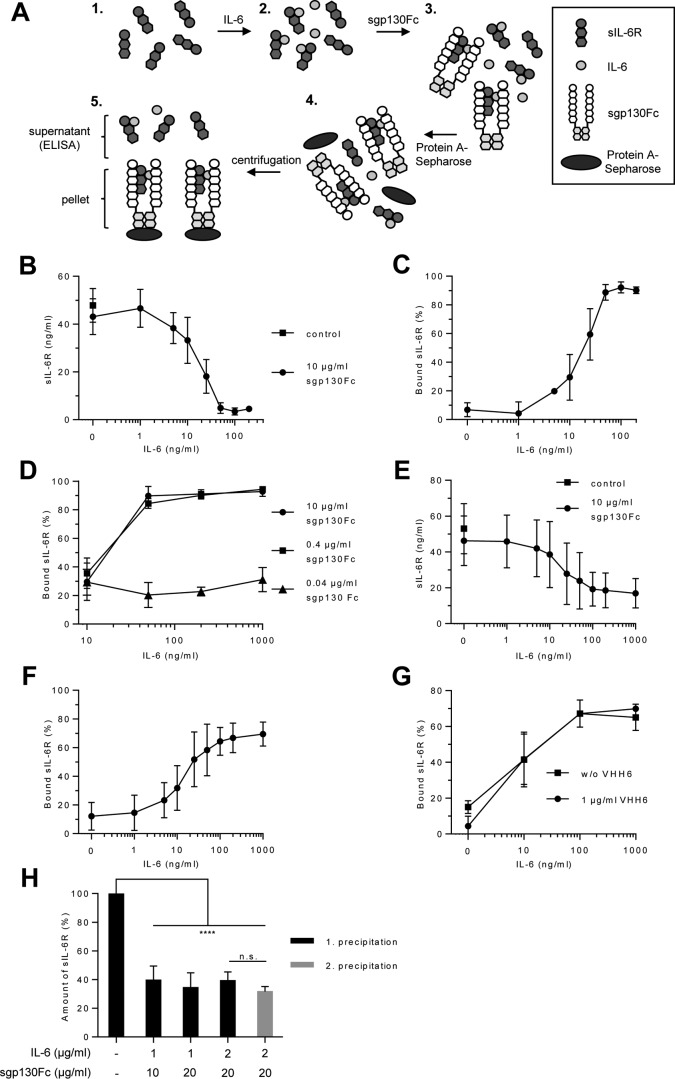
Figure 5.
Quantification of IL-6·sIL-6R·sgp130Fc complexes. A, schematic illustration of the precipitation of IL-6·sIL-6R·sgp130Fc by Protein A-Sepharose beads and subsequent analysis of the remaining sIL-6R in the supernatant. B, recombinant human IL-6 (1–200 ng/ml), sIL-6R (50 ng/ml), and sgp130Fc (10 μg/ml) were mixed. The resulting IL-6·sIL-6R·sgp130Fc complexes were precipitated with Protein A-Sepharose and sIL-6R in the supernatant was quantified by ELISA. Combined data were from five experiments. Error bars represent the S.D. C, the percentages of sIL-6R in IL-6·sIL-6R·sgp130Fc complexes were calculated from B. Error bars represent the S.D. D, recombinant human IL-6 (10–1,000 ng/ml), sIL-6R (50 ng/ml), and sgp130Fc (0.04–10 μg/ml) were mixed. The resulting IL-6·sIL-6R·sgp130Fc complexes were precipitated with Protein A-Sepharose and sIL-6R was quantified in the supernatant by ELISA. Mean of combined data were from three experiments. Error bars represent the S.D. E, recombinant human IL-6 (1–1,000 ng/ml), endogenous (serum) sIL-6R, and sgp130Fc (10 μg/ml) were mixed. The resulting IL-6·sIL-6R·sgp130Fc complexes were precipitated with Protein A-Sepharose and sIL-6R was quantified in the supernatant by ELISA. Serum of 10 human healthy volunteers was used. Mean of combined data were from 10 measurements. Error bars represent the S.D. F, the percentages of endogenous (serum) sIL-6R in IL-6·sIL-6R·sgp130Fc complexes were calculated from E. Error bars represent the S.D. G, recombinant human IL-6 (1–1,000 ng/ml), endogenous (serum) sIL-6R, sgp130Fc (10 μg/ml), and VHH6 (0 or 1 μg/ml) were mixed. IL-6·sIL-6R·sgp130Fc complexes were precipitated with Protein A-Sepharose and sIL-6R was quantified in the supernatant by ELISA. Mean of combined data were from three experiments. Error bars represent the S.D. H, recombinant human IL-6 (1 or 2 μg/ml), endogenous (serum) sIL-6R and sgp130Fc (10 or 20 μg/ml) were mixed. The resulting IL-6·sIL-6R·sgp130Fc complexes were precipitated with Protein A-Sepharose and sIL-6R was quantified in the supernatant by ELISA. The precipitation and sIL-6R ELISA quantification was repeated after a second addition of IL-6 (2,000 ng/ml) and sgp130Fc (20 μg/ml). Mean of combined data were from three experiments. Error bars represent the S.D.

