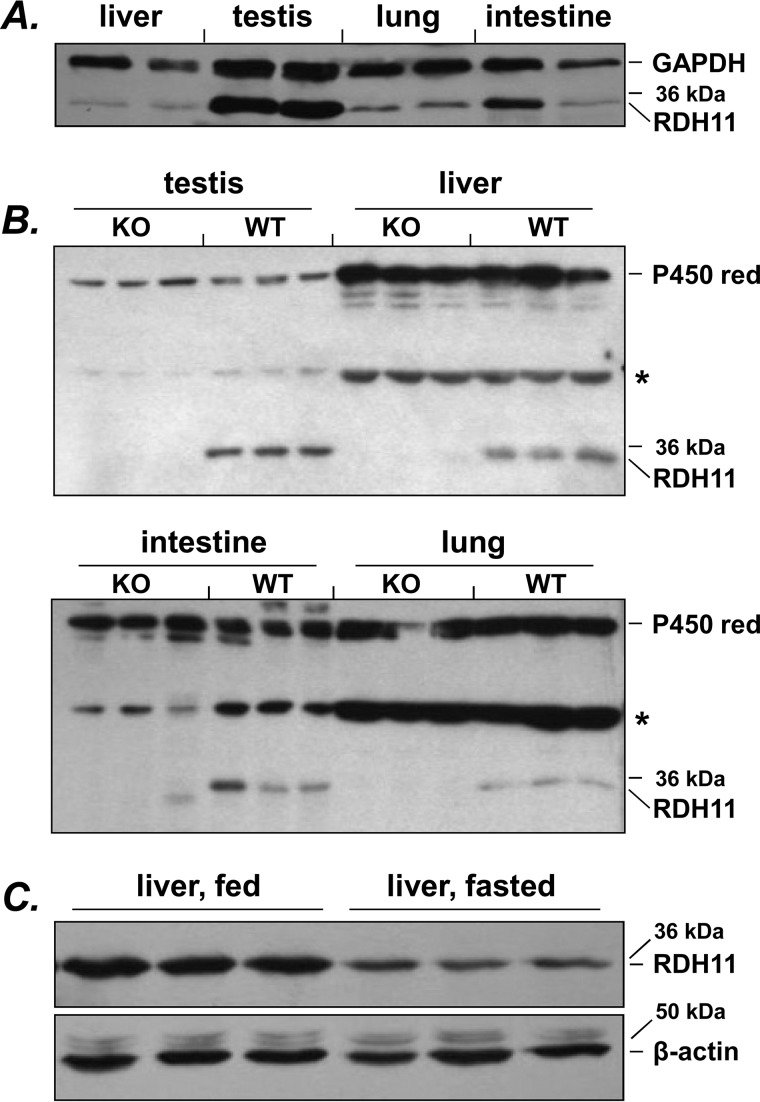
Figure 1.
Distribution of RDH11 in mouse tissues. A, comparison of RDH11 protein levels in microsomes from various tissues. Samples of tissues from two individual animals were used. Immunoblotting was performed using 1:2,500 dilution of SCALD antibodies (3). Considering that it is difficult to find a reference protein that is expressed at equal levels in different tissues, we used loading based on protein amount (20 μg from each tissue) to compare RDH11 protein levels across tissues. In addition, staining for GAPDH was used as an independent loading control, with understanding that GAPDH levels can vary somewhat among tissues. GAPDH antibodies were from Sigma (catalog number G9545, lot 031M4817). B, analysis of RDH11 interindividual variability. Microsomes from tissues of three individual animals were analyzed for RDH11 knockout (KO) and wildtype (WT) mice. Note the absence of RDH11 protein in tissues from Rdh11−/− mice. Thirty μg of microsomal protein per lane was loaded for testis, and 50 μg for other tissues. For WT mice, the RDH11 protein band was identified using recombinant RDH11 expressed in Sf9 microsomes (10 μg) as a standard (not shown). For microsomes from the same tissue, CYP450 reductase (P450 red) was used a loading control. CYP450 reductase antibodies (1:2,500 dilution for testis and liver and 1:4,000 dilution for intestine and lung) were from Chemicon (catalog number AB1257, lot 23050777). The star indicates nonspecific bands recognized by RDH11 antibodies. Note the variability of RDH11 protein levels in the intestine (duodenum plus jejunum). C, changes in RDH11 expression in liver of WT mice after overnight fasting. Fifty μg of microsomal protein was loaded per lane; β-actin antibodies were from Abcam (catalog number ab8227, lot 951945).

