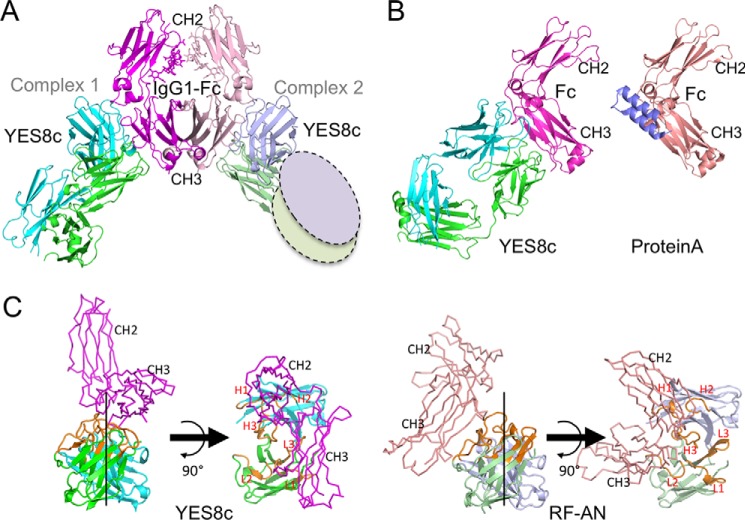
Figure 2.
Crystal structure of YES8c in complex with IgG1-Fc. A, overall structure of the YES8c–Fab–Fc complex in an asymmetric unit. In complex 1, the Fc and heavy and light chains are shown in magenta, cyan, and green, respectively, and in light pink, light blue, and light green in complex 2. The ovals show the missing constant region (CL and CH1). B, the YES8c–Fc complex and protein A–Fc complex (PDB code 1L6X) from the same viewpoint. C, comparison between the YES8c and RF-AN binding mode. In YES8c, the Fc and heavy and light chains are shown in magenta, cyan, and green, respectively, and in light pink, light blue, and light green in RF-AN. CDRs are shown in orange in the both structure.

