
Figure 2.
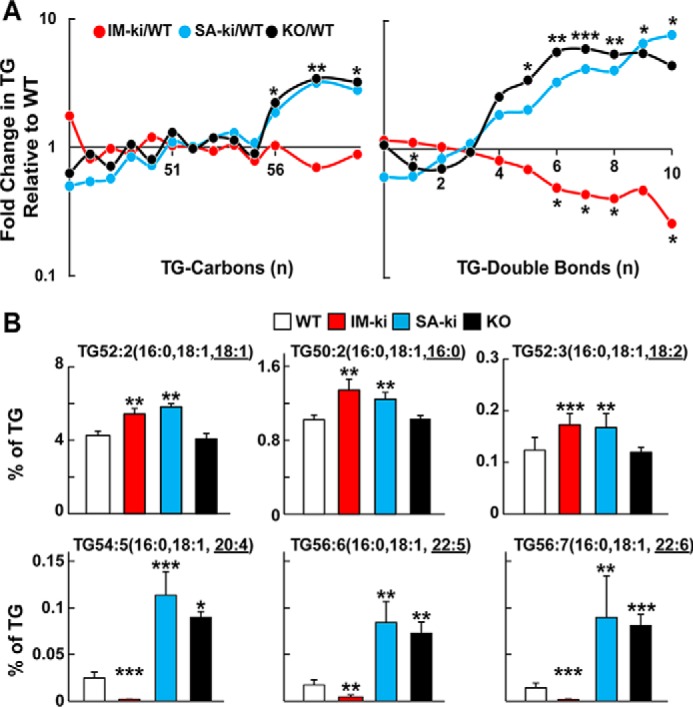
Hepatic TG composition in genetically modified PNPLA3 mice. A, the number of carbons (left) and number of double bonds (right) in hepatic TGs of IM-ki (red), SA-ki (blue), and KO (black) mice relative to their WT counterparts. Male mice were fed a HSD for 4 weeks (n = 6–8/group, 14 weeks old) and then sacrificed after 4 h of refeeding. Hepatic TGs were analyzed by direct infusion lipidomics. TGs were grouped based on number of FA carbons (left) or double bonds (right), as determined by the MS/MS signal from untargeted lipidomics analysis. Values were normalized to the total lipid signal and expressed relative to the corresponding value in WT mice. The data are plotted on a log-normal scale. B, selected TGs were measured by LC-MS/MS analysis. Shown are representative examples of abundant TGs (top) and vLCPUFA-containing TGs (bottom) in livers of PNPLA3 genetically modified mice. Mass pairs for identification of abundant TG were 876.7 and 577.6, 848.7 and 577.6, and 874.7 and 577.6 Da for the TGs shown left to right, respectively, and 898.8 and 577.7, 924.8 and 577.7, and 922.8 and 577.7 for the vLCPUFA-containing TGs shown left to right, respectively. Underlined FAs indicate the neutral loss of the measured species. Values were normalized to the sum of all measured TG signals. Liver TG analysis was repeated twice with similar results. Error bars, S.D. *, p < 0.05; **, p < 0.01; ***, p < 0.001.