Figure 5.
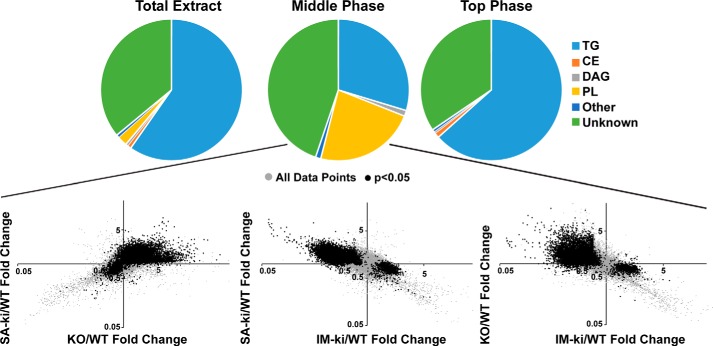
Lipidomic comparisons of lipid droplets. Top, lipid composition of LDs from a Bligh–Dyer extract compared with the middle and top phase of a three-phase extraction based on direct infusion lipidomics analysis. Lipids were identified based on their tandem mass pairs. Lipid features that were not identified were classified as unknown lipids. Reported values are means of livers (n = 4). -Fold change of KO mice relative to WT mice LDs were plotted against the -fold change in SA-ki to WT mice. Hepatic LDs were prepared from male mice on a HSD for 4 weeks (n = 5–7/group, 14 weeks old) after 4 h of refeeding. Each point represents the -fold change in KO mice on the x axis and SA-KI mice on the y axis. Values were normalized to the sum of all lipid signals. The relationship between IM-ki and SA-ki or KO mice relative to WT is also shown. Black points had a p value < 0.05 in the IM-ki mice. The analysis was repeated once with similar results.

