
Figure 7.
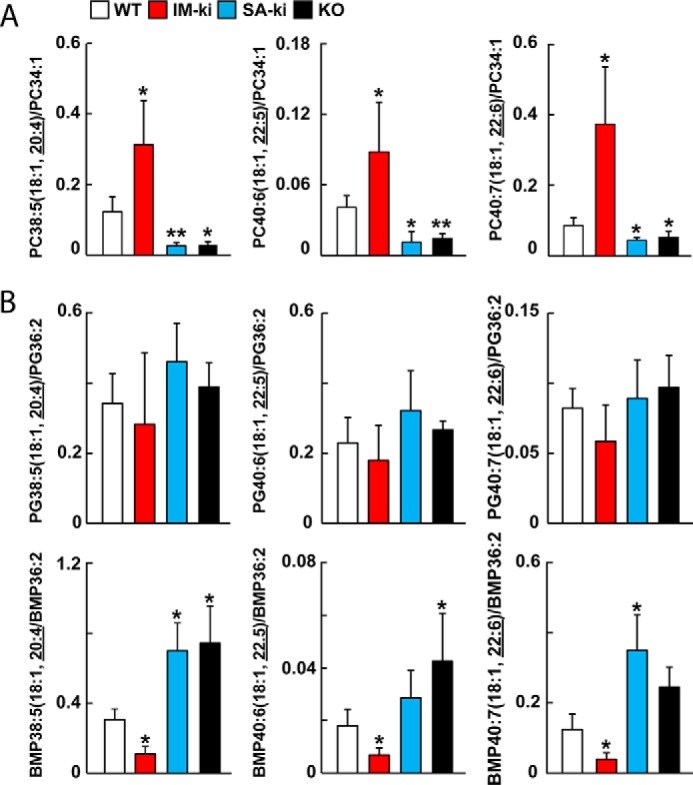
PL composition of hepatic LDs by targeted LC-MS/MS. PL composition of hepatic LDs from WT (white), IM-ki (red), SA-ki (blue), and PNPLA3 KO mice (black) was analyzed by targeted LC-MS/MS. Male mice (n = 5–7/group, 14 weeks old) were fed a HSD for 4 weeks and refed for 4 h before collecting tissues. PCs (A), PGs, and BMPs (B) were targeted for analysis using LC-MS/MS. Individual PGs were identified by their negative ion with the MS2 of the vLCPUFA. Values were normalized to an abundant PL in the same class, as indicated by the denominator on the y axis. Analysis was repeated once, and the results were similar. Error bars, S.D.; *, p < 0.05; **, p < 0.01.