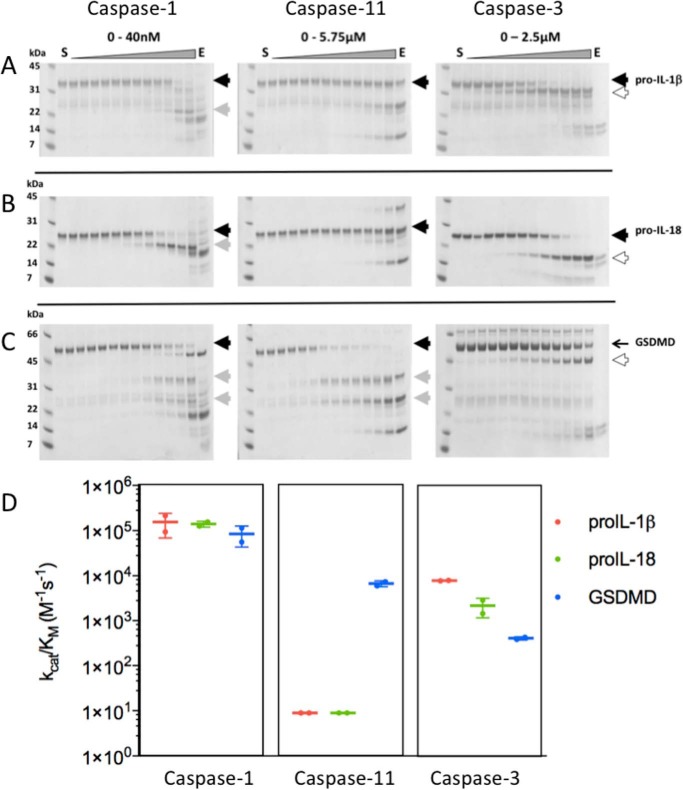
Figure 4.
Cleavage rates of substrate proteins by caspases. To test catalytic efficiency of caspases on A, pro-IL-1β, B, pro-IL-18, and C, GSDMD, the indicated enzymes were active site titrated using Z-VAD-fmk, incubated with 4 μm substrates for 30 min at 37 °C, and run in SDS-PAGE. Gel densitometry of the remaining uncleaved substrate yielded IC50 values from which catalytic rates kcat/Km were determined according to Equation 1 (“Materials and methods”). The precursor proteins are shown by a solid black arrowheads, derivatives of each substrate are indicated by the gray or white arrowheads. Importantly, although the apoptotic caspase-3 cleaved the proteins, each site was distinct from those generated by inflammatory caspase-1 and -11 (white arrowheads). The gels above are representative of two biological replicates employing different caspase preparations. D, comparative kcat/Km values are described by the colored symbols, as indicated in the key. Caspase-3 cleaved all three proteins, but at sites distinct from those generated by caspase-1 and -11, as discussed in the text. Data are averages from two biological replicates, and the error bars indicate standard deviations.

