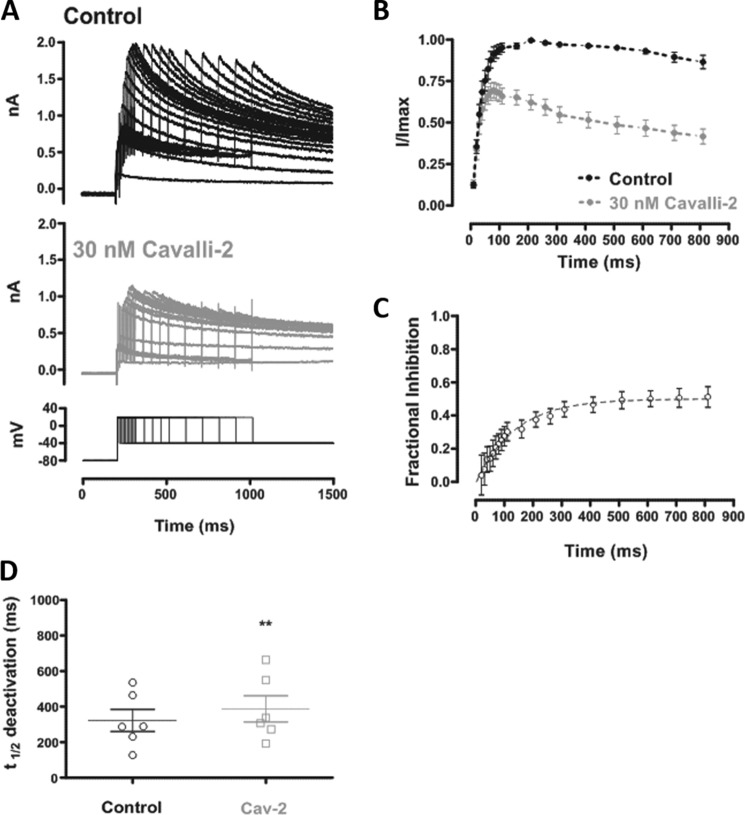
Figure 3.
The time dependence of IhERG inhibition by Cavalli-2. A, representative traces of IhERG in control (upper panel) and in the presence of 30 nm Cavalli-2 (lower panel) elicited by the “envelope-of-tails” protocol shown at the bottom of the lower panel. B, time dependence of normalized tail IhERG in control (black) and in the presence of 30 nm Cavalli-2 (gray) (n = 6). Data at each time point were normalized to the maximum tail current elicited by the protocol in control. Lines connect successive points in each plot. C, time dependence of fractional block of IhERG by 30 nm Cavalli-2 fitted with a monoexponential function (n = 6; time constant = 140.9 ± 33.4 ms). D, scatter plot comparing t½ of IhERG deactivation in control and after application of 30 nm Cavalli-2 (Cav-2) using the protocol shown in Fig. 2B. n = 6; unpaired t test. Error bars represent means ± S.E.

