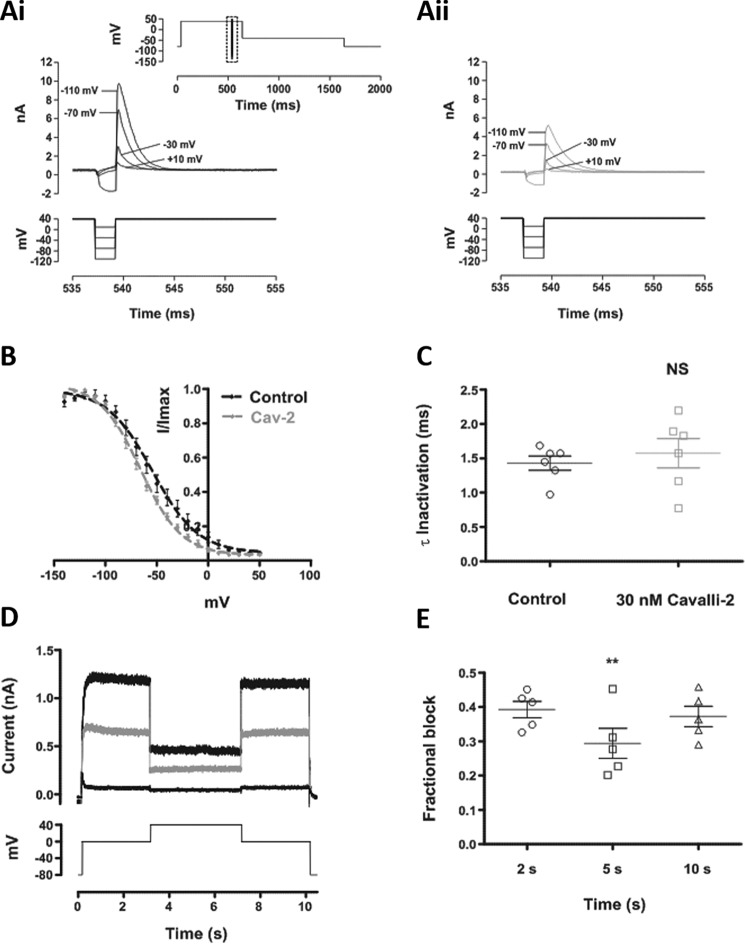
Figure 4.
Effect of Cavalli-2 on hERG channel availability. A, upper traces show WT IhERG elicited by the “availability protocol” (from a holding potential of −80 mV, the membrane was depolarized to +40 mV (500 ms) and then briefly (2 ms) repolarized to a test potential ranging from −140 to +50 mV before returning to +40 mV). The full protocol is shown in the inset; the traces focus on the boxed area from the full protocol in control (A, panel i) and in the presence of 30 nm Cavalli-2 (A, panel ii). B, voltage dependence of the normalized resurgent current elicited by the third step of the availability protocol in control (black) and in the presence of 30 nm Cavalli-2 (Cav-2) (gray) (n = 6). V0.5 = −56.0 ± 1.9 mV and k = 21.3 ± 1.9 and V0.5 = −62.4 ± 1.4 mV and k = 20.1 ± 1.3 in control and in the presence of 30 nm Cavalli-2, respectively. C, scatter plots comparing time constants of IhERG inactivation calculated by fitting the peak transient current at +40 mV after a 2-ms step to −120 mV with a monoexponential decay function (n = 6; NS, not significant, p > 0.05, Wilcoxon matched-pairs signed-rank test). D, current records in control (thick black line) and after application of 30 nm Cavalli-2 (gray line) elicited by the voltage protocol shown (lower trace) applied from a holding potential of −80 mV. The thin black line shows current remaining after application of 5 μm E-4031. E, scatter plot comparing level of IhERG block at 2 (0 mV), 5 (+40 mV), and 10 s (0 mV). n = 5; **, p < 0.005, one-way ANOVA. Scatter plots in C and E show individual data points. All error bars represent means ± S.E.

