
Figure 2.
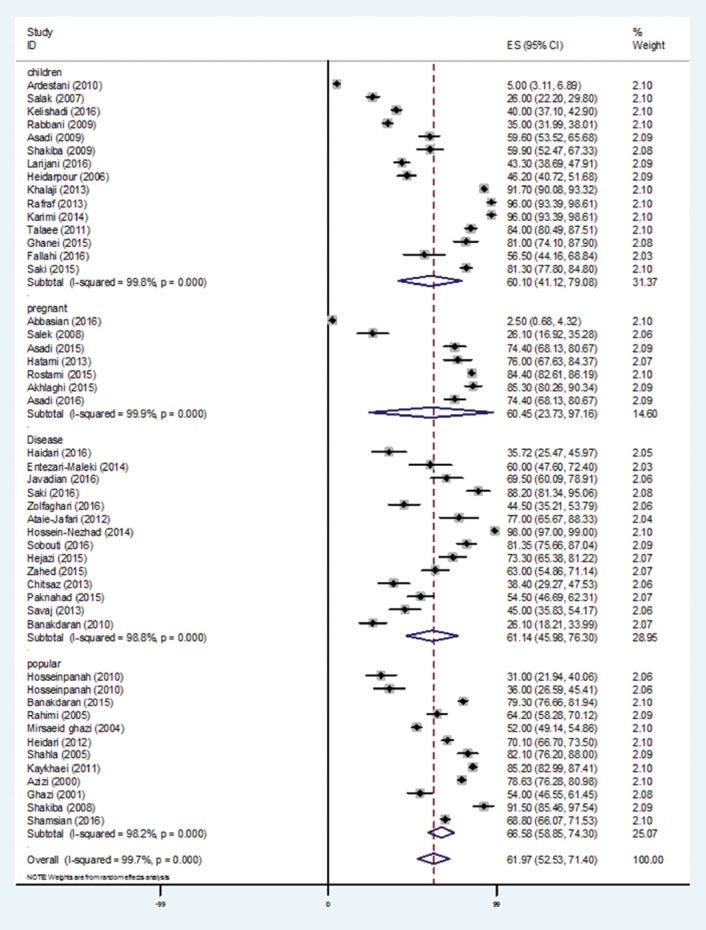
Prevalence of overall vitamin D deficiency in the Iranian population by the random-effect model for each of the 48 included studies. For each study, the estimate of prevalence and its 95% confidence interval were plotted with a box and a horizontal line.