Figure 4.

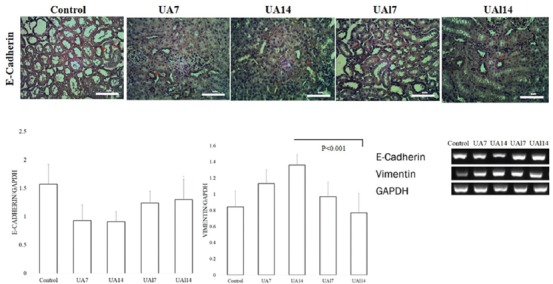
A. Immunohistochemical (IHC) staining of E-cadherin. Arrows show E-cadherin protein expression. B-C. Quantification of E-cadherin and vimentin expression based on the reverse transcriptase-polymerase chain reaction (RT-PCR) results.

A. Immunohistochemical (IHC) staining of E-cadherin. Arrows show E-cadherin protein expression. B-C. Quantification of E-cadherin and vimentin expression based on the reverse transcriptase-polymerase chain reaction (RT-PCR) results.