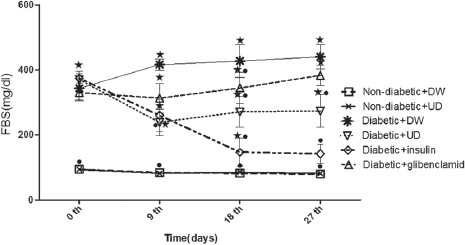
Figure 1.

Comparison of fasting blood sugar in 6 groups of experimental rats (n=8) during 27 days. Data represent the average of the results of all rats in each group. *Significant difference between non-diabetic plus DW group vs. all groups; ●-Significant difference between diabetic plus DW group vs. all groups (P<0.05).
