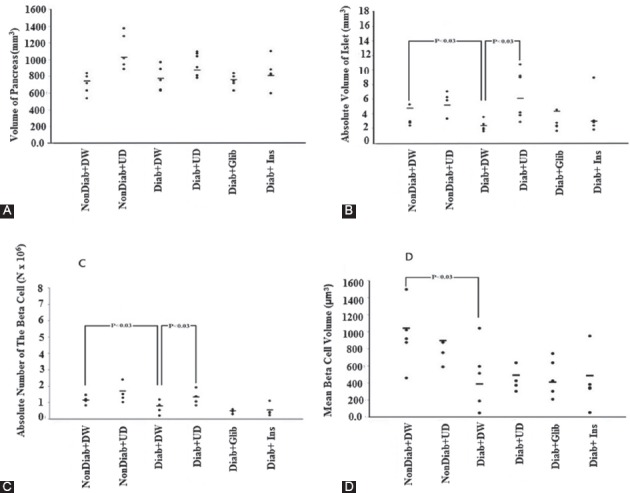
Figure 3.

The estimated parameter using stereological methods in 6 groups of experimental rats (n=8). The dot plots show the total volume of the pancreas (A), absolute volume of the islet (B), total number of the β-cells (C), and mean β-cells volume (D). Each dot represents an animal in different groups. The significant differences are indicated in the figures.
