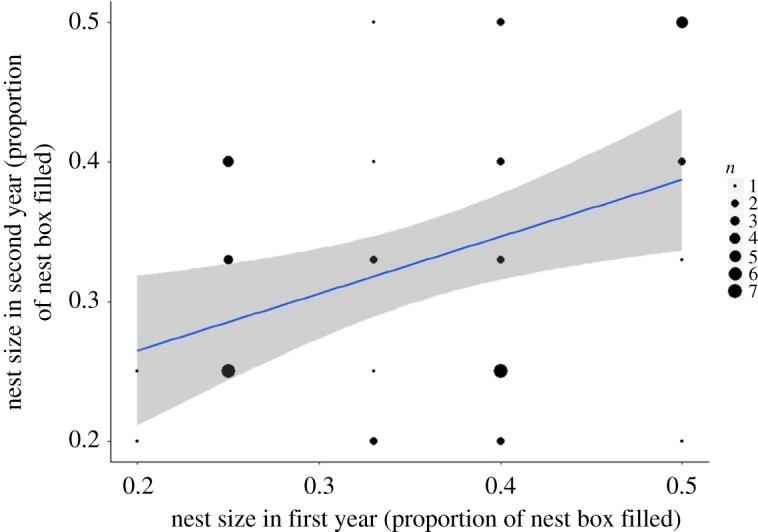
Figure 3.

The relationship of nest size of a second nest compared to the nest from previous years in the same nest box by blue tits (Cyanistes caeruleus) in Wytham Woods, Oxfordshire, UK. Data were collected in April–May 2001–2003. These data are from nest boxes which were used more than once in the study period by different females, n = 107 nests in 57 nest boxes. The line of best fit represents the variation explained by a linear mixed effects model including box identity, compartment and year, χ2 = 23.07, R2 = 0.265; the grey shaded area shows 95% confidence interval.
