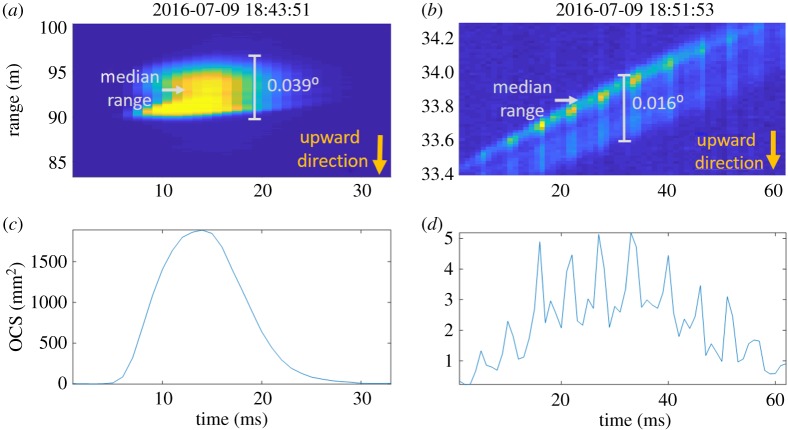
Figure 2.
Examples of time-range maps of a large object observation (a) and a small object observation (b); (c) and (d) display the time series of (a) and (b), respectively. The observation of a small organism (presumably an insect) flying away from the detector displays a typical time modulation of the signal due to the wing beats. The observation of the larger organism in (a) does not display this kind of modulation because its wing beat frequency is too low to be resolved during its transect through the laser beam. In Scheimpflug Lidar range is determined from pixels at a specific observation angle, but the width of the beam induces a range uncertainty and observations of larger organisms will cover several pixels. The pixel interval can be represented as an opening angle for an observation. This corresponds to the difference in observation angle between its first and last pixel. The opening angle of each observation is marked in grey in (a) and (b). The opening angle and the median range are used to calculate the angular size of the observation. The wings of the organism give rise to a larger spread in the signal in the range direction when they are pointing up and down. The Lidar system monitored the laser beam from below. This means that when the wings of an organism are in a downward position the signal will be spread out towards ranges further away from the Lidar system and when they are in the upwards position the signal will be spread out towards closer ranges. The yellow arrows in the lower-right corners of the figures indicate the direction the signal will be spread out in when the wings of an organism are in the upwards direction. From this, it become clear that the large organism in (a) has the shape of a bat/bird with its wings in a downward position when it passes through the beam. It can also be concluded that the wing beats of the insect in (b) are visible when the wings are in the upwards position.

