Figure 3.

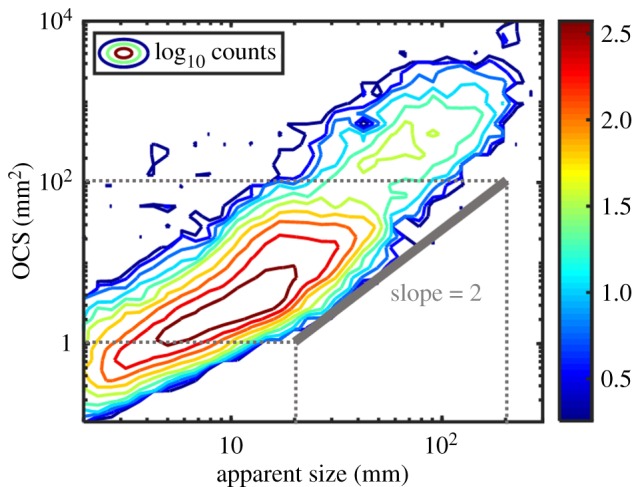
Contour plot of the OCS and the apparent size of the Lidar data evaluated in this paper. The grey line represents a slope of 2.

Contour plot of the OCS and the apparent size of the Lidar data evaluated in this paper. The grey line represents a slope of 2.