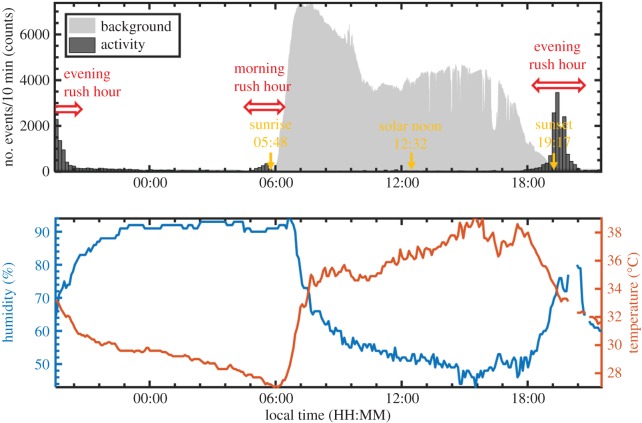
Figure 4.
An overview of the activity (number of observations detected by the Lidar system, n = 27, 212), and the environmental conditions (temperature and humidity) prevailing on 8 and 9 July 2016. During dawn and dusk there was a clear increase in the number of observations, indicated as ‘rush hour’. The optical background level is shown in grey. The activity and background readings are shown on a linear scale in this case.

