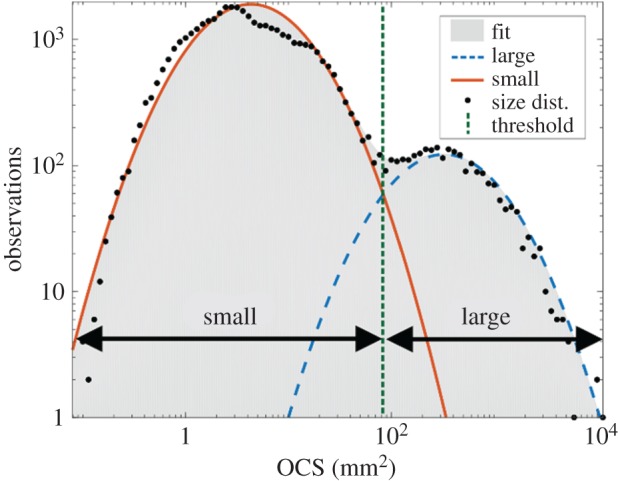
Figure 5.

A histogram of the maximum OCS of each observation during two dusk and two dawn periods plotted on logarithmic scales. This size distribution has two distinct modes—one for small objects and one for large ones. Two parabolas were fitted to these modes. The intersection between the two fitted curves was used to set a size threshold for the discrimination between small and large targets. The resulting threshold is 84 mm2.
