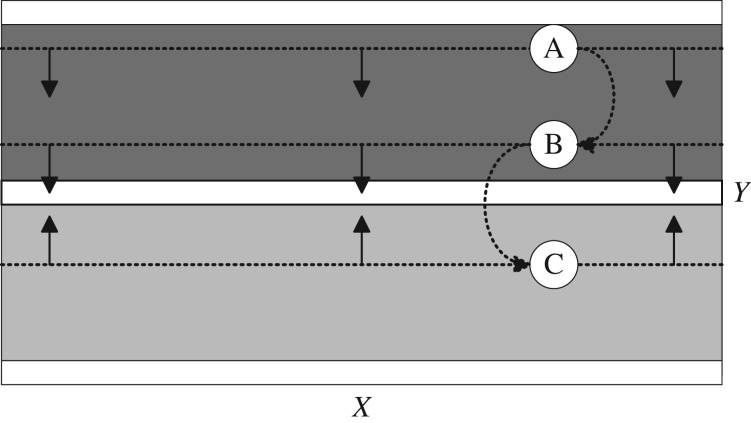
Figure 14.
A schematic showing the method used to dynamically constrain the region searched for driver location by cross-referencing flow information against the flow direction maps shown in figure 10. This schematic uses the Y flow map to constrain the Y predictions. An equivalent (but less accurate) flow map can be generated for the X direction. At each point in the CMP model, the net flow across the electrode grid can be calculated. This flow is strongly dependent on position relative to the recording position’s closest driver. White regions indicate regions of zero net flow in the Y direction corresponding to the driver axis (central white region) and the axis of wavefront collision (top and bottom white regions). The dark and light grey regions indicate net flow in the +Y and −Y directions, respectively. For each set of electrogram recordings, the flow can be calculated. If +Y flow is detected, the driver must be in the −Y direction from the current position (cases A & B), and vice versa (case C). With each new electrogram recording the search area is restricted towards the driver’s X axis.

