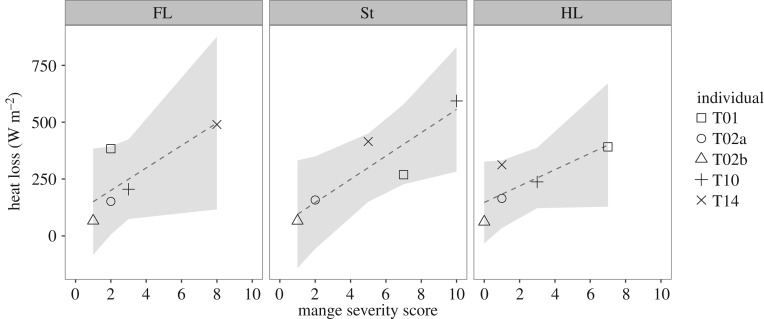
Figure 3.
Heat loss (W m−2) from three body segments in healthy and mange-infected wombats (n = 5) with 95% CIs (grey). As the segment mange score increased, the amount of heat lost increased in the FL (R2 = 0.50, F1,3 = 5.01, p = 0.11), St (R2 = 0.75, F1,3 = 12.74, p = 0.04) and HL (R2 = 0.49, F1,3 = 4.91, p = 0.11). Individuals are identified to show the variation in mange severity across body locations, reflecting infection asymmetry and inter-individual variation.

