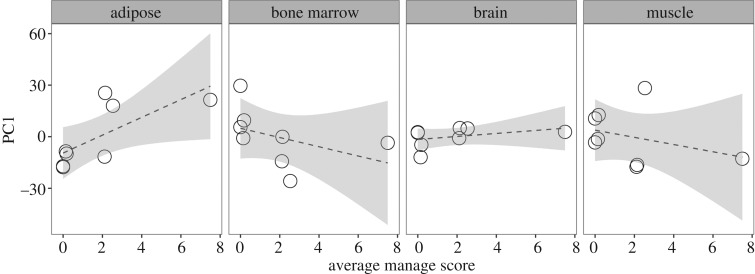
Figure 6.
The relationship between average mange severity score and the fatty acid composition of four tissue types. Regressions were run for each tissue type using PC1 predictor values (from PCA of 14 fatty acids, table 2) and average mange severity scores. There was a significant relationship between adipose fatty acid composition and mange severity (F1,6 = 6.40, p = 0.04, R2 = 0.44), but no significant relationship in other tissues (bone marrow F1,6 = 1.25, p = 0.30, R2 = 0.03; brain F1,6 = 1.04, p = 0.35, R2 = 0.01; muscle F1,6 = 0.73, p = 0.43, R2 = −0.04).

