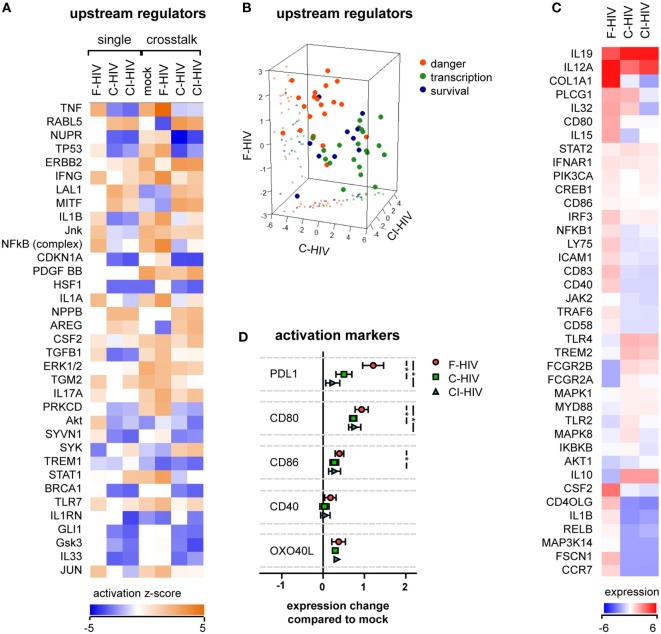
Figure 2.
HIV effects on dendritic cell (DC) activation in the absence or presence of natural killer (NK) cells. DCs were exposed to 1 μg/ml F-HIV, complement-opsonized HIV complement- and antibody opsonized HIV (CI-HIV), CI-HIV, or mock treated either in DC single culture, or in a cross talk culture consisting of NK cells and DCs from the same donor at a 1:1 ratio for 24 h. The experiment was replicated three times using cells derived from three different donors. (A) RNAseq was performed on the DCs from the single culture or DCs isolated from the NK–DC cross talk, and the genes that were significantly differentially expressed were analyzed using IPA (Qiagen) to determine the most affected upstream regulators. (B) The top upstream regulators were divided into functional groups, and a 3D scatterplot was used to visualize clustering. (C) A heatmap was generated for genes that were significantly differentially expressed in at least one condition and that were defined by IPA to be involved in DC maturation. The heatmap shows fold change in the virus exposed cross talk samples compared to the mock treated cross talk samples. (D) The protein expression of surface activation markers on the DCs from the cross talk cultures was assessed using flow cytometry, and the values normalized to the expression in the mock-treated cross talk culture. One-way ANOVA followed by a Bonferroni posttest was used to test for statistically significant differences in protein expression. Boxplots show mean ± SEM (*p < 0.05).

