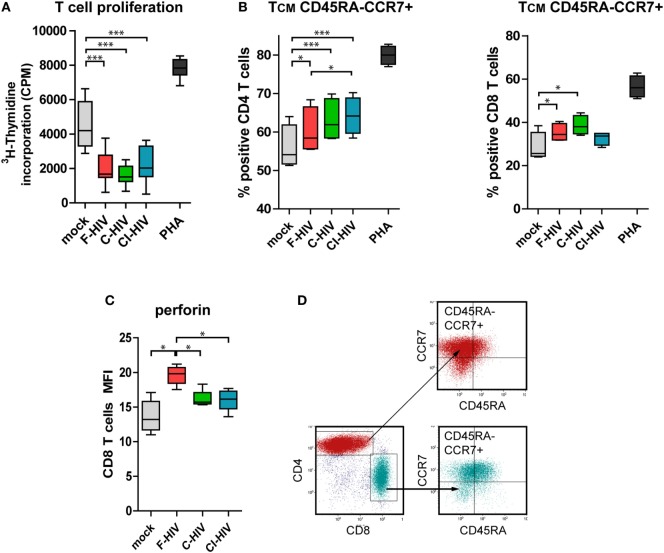
Figure 6.
T cell proliferation and memory phenotype activated by natural killer (NK) cell–dendritic cell (DC) stimulation assay. DCs and NK cells from the same donor were exposed to 1 μg/ml F-HIV, complement-opsonized HIV (C-HIV), complement- and antibody opsonized HIV (CI-HIV), PHA, or mock-treated for 24 h. The experiment was replicated four times using cells derived from four different donors. Allogeneic T cells were stimulated by cells from these cultures at a 1:10 DC:T cell ratio. (A) T cell proliferation was assessed using a 3H-Thymidine incorporation assay. (B) Supernatants from the NK–DC cross talk cultures were added to allogeneic T cells stimulated by CD3/CD28 ligation and the percentage of cells with central memory (TCM) phenotype in the CD4 and CD8 T cell populations was determined using flow cytometry. (C) The amount of perforin in the CD8 T cells from the NK–DC stimulation assay was evaluated. (D) Gating strategy for flow cytometry analysis of a representative sample can be seen in. Boxplots show mean with Tukey error bars. One-way ANOVA followed by a Bonferroni posttest was used to test for statistical significance (*p < 0.05, N = 4).

