Figure 1.
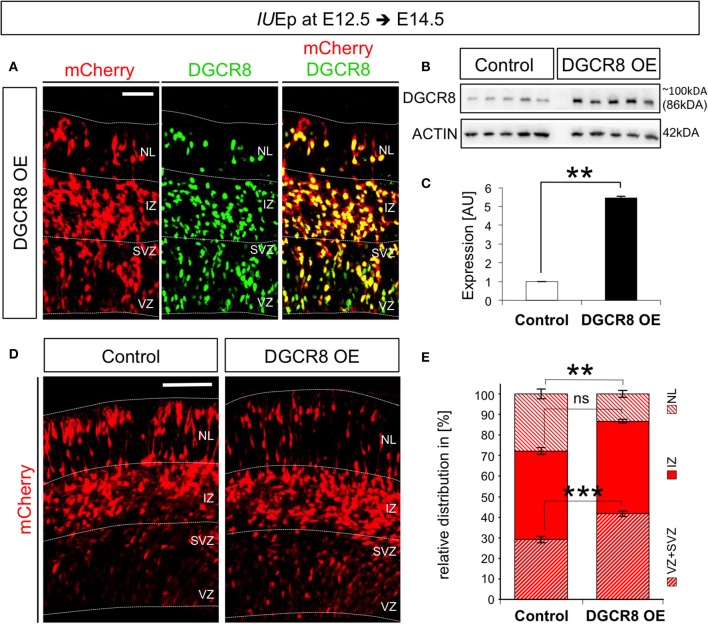
Overexpression of DGCR8 in the mouse telencephalon alters the relative distribution of cells across the cortical wall (A) Immunofluorescence staining for DGCR8 and intrinsic mCherry fluorescence in coronal cryosections through the dorsal telencephalon of mouse embryos at E14.5 overexpressing DGCR8 (B,C), after IUEp at E12.5. (B) Western blot of DGCR8, and (C) Quantification of DGCR8 protein level in the telencephalon of E14.5 mice electroporated at E12.5 with pCAGGS-mCherry (Control, white bar, 5 independent pools shown) or pCAGGS-mCherry and pCAGGS-Dgcr8 plasmids (DGCR8 OE, black bar, five independent pools shown). Values are normalized on ACTIN. Error bars indicate the variation of five Control and five DGCR8 OE independent pools (s.e.m.); each independent pool consists of four to five dissected electroporated cortical areas; unpaired Student's t-test. (D) Immunofluorescence microscopy of coronal cryosections through the telencephalon at E14.5 after IUEp at E12.5 showing intrinsic mCherry fluorescence (red), as reporter of targeted cells. Dashed lines indicate borders of specific brain areas (from outside to inside: NL: neuronal layer, IZ: intermediate zone, SVZ: subventricular zone and VZ: ventricular zone), scale bar: 100 μm. (E) Quantification of the relative distribution of electroporated cells in NL, IZ, and SVZ+VZ expressed in % over total mCherry+ cells; Error bars indicate the variation of four Control and five DGCR8 OE electroporated cortices (s.e.m.); unpaired Student's t-test. **p-value < 0.01; ***p-value < 0.001.

