Figure 5.
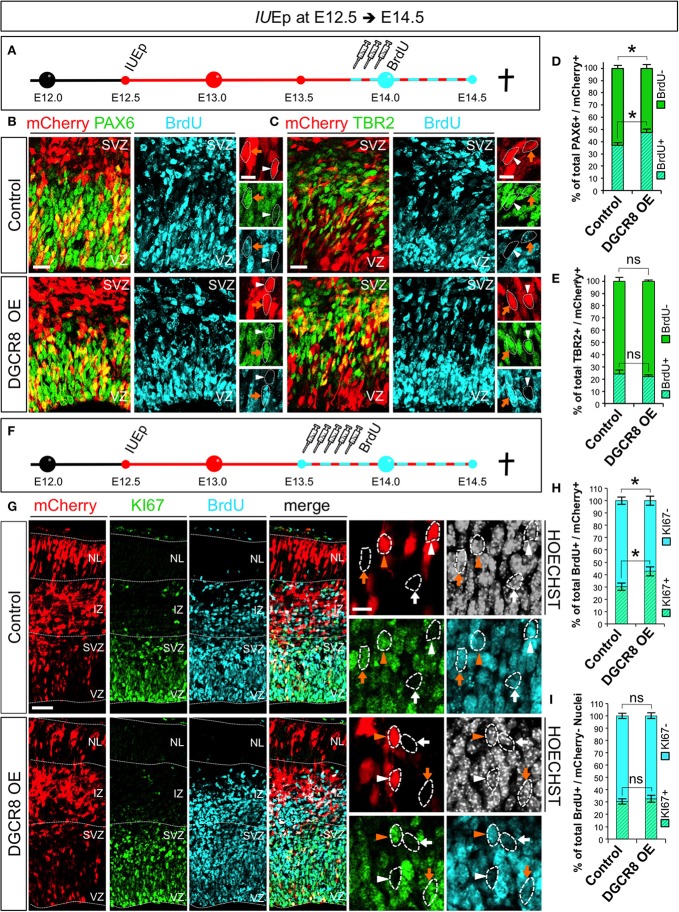
Overexpression of DGCR8 stimulates NPC proliferation and cell cycle re-entry (A) Schematic representation of in utero electroporation and 10 h BrdU pulse/chase experiment. B,C) Co-Immunostaining for PAX6 (B, green) or TBR2 (C, green), BrdU (B,C, cyan) and mCherry+ electroporated cells (B,C red) on coronal cryosections through the dorsal telencephalon of Control and DGCR8 OE mouse embryos at E14.5 after IUEp at E12.5. D,E) Quantification of the proportion of mCherry+PAX6+ that were BrdU+, or BrdU− (D); or mCherry+TBR2+ that were BrdU+ or BrdU− (E) cells, expressed in % over total mCherry+PAX6+(or mCherry+TBR2+) cells in a selected area (i.e., VZ+SVZ); scale bar: 20 and 10 μm in high magnification images; white arrowheads: mCherry+ and PAX6+ or TBR2+ cells that are BrdU−, orange arrows: mCherry+ and PAX6+ or TBR2+ cells that are BrdU+. Error bars indicate the variation of five Control and six DGCR8 OE electroporated cortices (s.e.m.); unpaired Student's t-test. (F) Schematic representation of in utero electroporation and 24 h BrdU pulse/chase experiment. (G) Co-Immunostaining for KI67 (green), BrdU (cyan), mCherry+ electroporated cells (red), and Nuclei (Hoechst, gray) on coronal cryosections through the dorsal telencephalon of Control and DGCR8 OE mouse embryos at E14.5 after IUEp at E12.5. (H) Quantification of the proportion of KI67+ (cell cycle re-entry) or KI67− (cell cycle exit) BrdU+ mCherry+ cells expressed in % over total BrdU+ mCherry+ cells across the whole cortical wall. (I) Quantification of the proportion of KI67+, or KI67−, BrdU+ mCherry− cells expressed in % over total BrdU+ mCherry– cells (identified by Hoechst) across the whole cortical wall (same ROI as in H); VZ: ventricular zone, SVZ: subventricular zone and NL: neuronal layer; scale bar: 100 and 10 μm in high magnification images; white arrowheads: mCherry+ and BrdU+ cells that are KI67−, orange arrowheads: mCherry+ and BrdU+ cells that are KI67+, white arrows: mCherry– BrdU+ cells that are KI67− and orange arrows: mCherry− BrdU+ cells that are KI67+. Error bars indicate the variation of five Control and five DGCR8 OE electroporated cortices (s.e.m.); unpaired Student's t-test. *p-value < 0.05.

