
Fig. 3.
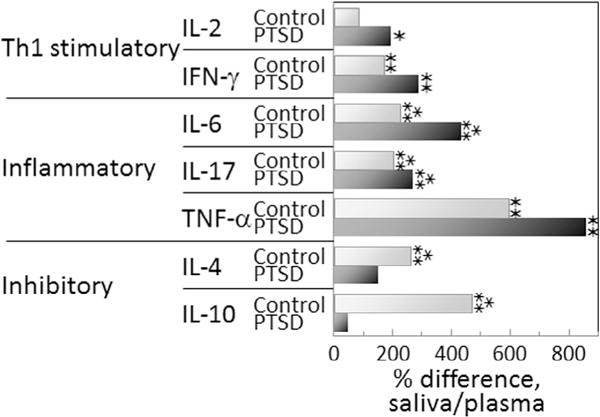
Greater cytokine levels in saliva compared to levels in plasma in both control and PTSD subject groups, but the increases in Th1 and inflammatory cytokines in saliva are more prominent for PTSD subjects. The percent increase in cytokine levels in saliva over levels in plasma were calculated from the means of the cytokine levels for each group of subjects by the following formula:
The significance of the difference in levels of each cytokine in plasma versus saliva was determined by the Mann-Whitney U test: ✶ = p < 0.05, ✶✶ = p < 0.01;
 = p < 0.005.