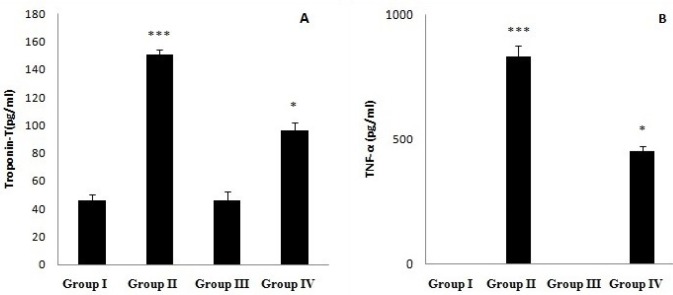
Figure 2.
A) Serum Troponin-T (Tn-T) level and (B) Tumur Necrosis Factor-α (TNF- α) content activity in normal (Group I), CEL per se (Group II), BPS per se (Group III), CEL + BPS (Group IV). Values are expressed as mean ± SEM (n = 8) and analyzed by one-way ANOVA followed by Tukey-Kramer multiple comparison test.*p < 0.05 IV v/s II, ***p < 0.001 II v/s I. CEL: Celecoxib, BPS: Beraprost Sodium

