
Figure 3.
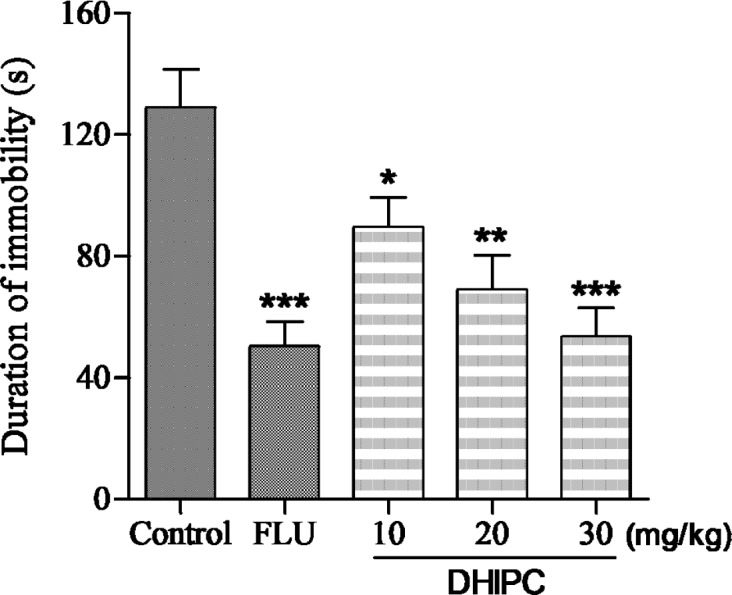
Effect of DHIPC on immobility time in the forced swim test in mice. Data are expressed as the mean ± SEM (n = 8). Symbol (*, ** or ***) indicates statistically significance in comparison to vehicle at p < 0.05, p < 0.01, p < 0.001
Official websites use .gov
A
.gov website belongs to an official
government organization in the United States.
Secure .gov websites use HTTPS
A lock (
) or https:// means you've safely
connected to the .gov website. Share sensitive
information only on official, secure websites.
Effect of DHIPC on immobility time in the forced swim test in mice. Data are expressed as the mean ± SEM (n = 8). Symbol (*, ** or ***) indicates statistically significance in comparison to vehicle at p < 0.05, p < 0.01, p < 0.001