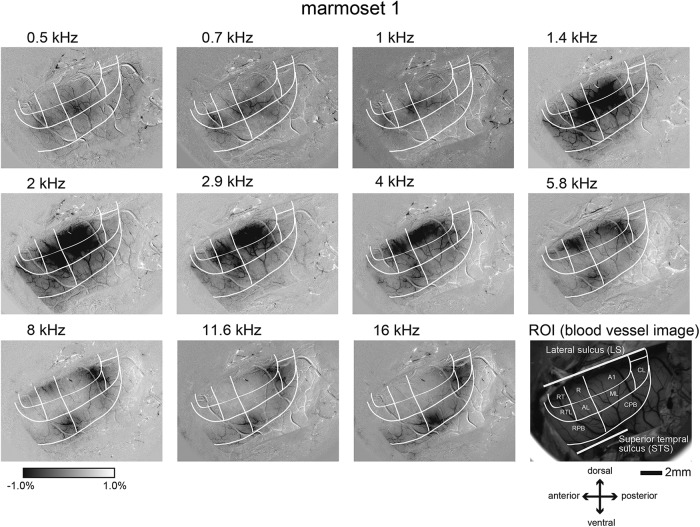
Figure 2.
Optical responses to sound frequencies in the auditory cortex of the marmoset shown in Figure 1. A single condition map was reconstructed based on the optical signal changes in response to sound frequencies of 0.5, 0.7, 1, 1.4, 2, 2.9, 4, 5.8, 8, 11.6, and 16 kHz. The response magnitude is indicated by the gray scale shown at the left bottom. The black and white regions indicate the highest and lowest response magnitudes, respectively. The white lines represent the histologically defined areal borders of the auditory cortex.

